Bitcoin Price Analysis: Whale Accumulation and ETF Outflows
Bitcoin is currently trading near the $115,000 mark, down 3% this week and 2.5% this month, sitting 7% below its all-time high. This pullback has led to a cooling market, with the price slipping around 6% from its Aug. 14 all-time high. The market is still split over whether this is a healthy retracement within a larger uptrend or the beginning of a more significant correction.
The recent price action has been influenced by exchange-traded fund (ETF) outflows, with U.S. spot Bitcoin ETFs seeing $121 million in net outflows on Aug. 18, pushing monthly outflows to nearly $140 million. In contrast, Ethereum (ETH) has attracted a record $2.83 billion in inflows in the past month, with year-to-date Ethereum inflows now reaching $11 billion, compared to $5.3 billion for Bitcoin.
Whale Accumulation and Market Sentiment
Despite the ETF outflows, whale wallets have been quietly expanding their holdings. According to Santiment’s latest on-chain data, wallets with 10–10,000 BTC have added over 20,000 BTC since last week’s pullback, bringing their total accumulation to over 225,000 BTC since March. This trend is often linked with price recovery, and market analyst Rekt Capital notes that Bitcoin is at a point in the cycle where shallow retraces historically set the stage for strong upside.
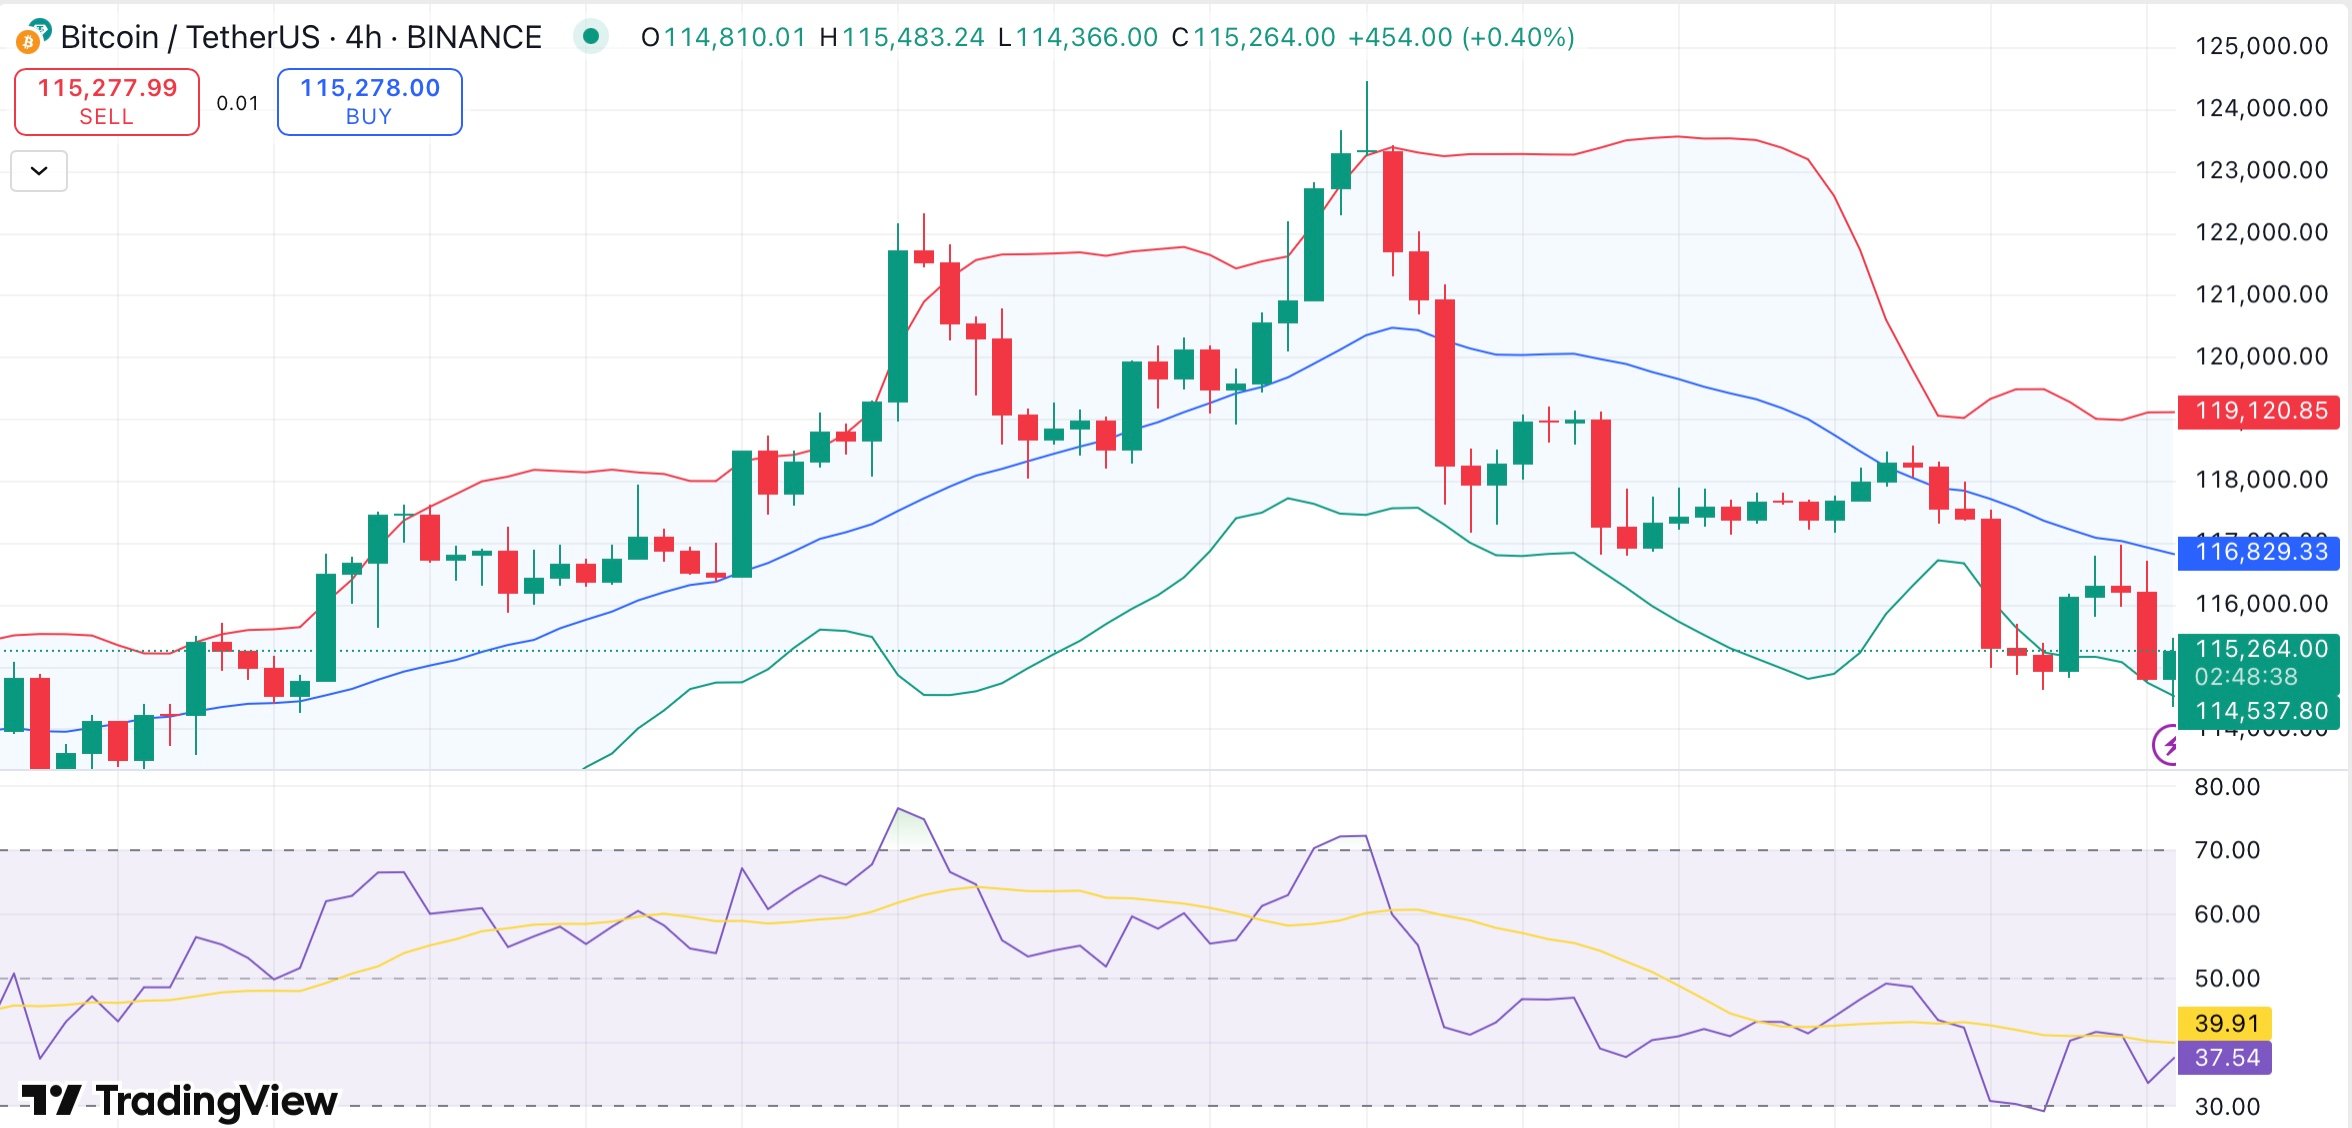
Historical data shows that quick pullbacks of 25–29% have acted as technical resets before fresh rallies in both 2017 and 2021. If $114,000 holds as support, it could mark the foundation for a new price discovery phase. The relative strength index (RSI) is nearing oversold territory at 38, suggesting that selling pressure may be waning.
Technical Analysis and Price Projections
Bitcoin is below the midline of its Bollinger Bands on the 4-hour chart, indicating downward pressure. The bands are starting to tighten, which is often a sign of larger movements. The short-term EMAs (10–30) are leaning bearish, but the 50-, 100-, and 200-day moving averages still show signs of support for the overall trend.
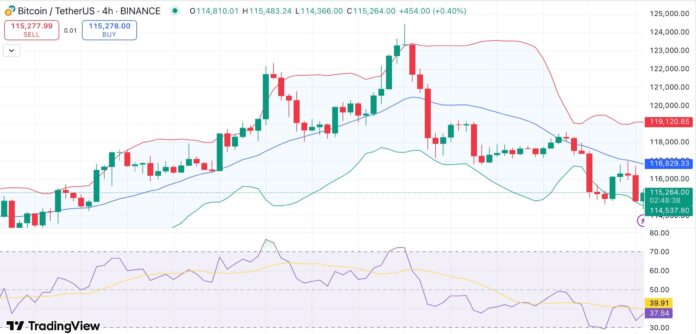
 Bitcoin 4-hour chart. Credit: crypto.news
If whales continue to accumulate and the $114,000 support holds, Bitcoin might rise back toward the $118,000–$120,000 range. A retest of the most recent all-time high of $124,000 might be feasible if volume confirms. The 100-day and 200-day moving averages, or about $110,000 and $103,000, are the next significant supports. Failure to defend $114,000 could lead to a more severe correction.
For more information and updates on Bitcoin and the cryptocurrency market, visit https://crypto.news/bitcoin-etfs-outflows-btc-whale-buys-reversal-2025/

