Bitcoin’s recent price drop has sparked a heated debate among traders and analysts, with some predicting a crash to $60,000 and others expecting a rebound to $140,000 or higher. The cryptocurrency has dropped by more than 12.75% from its record high of over $124,500, leaving investors wondering whether this is a routine bull market correction or the start of a new bear cycle.
Analyzing Bitcoin’s Price Movement
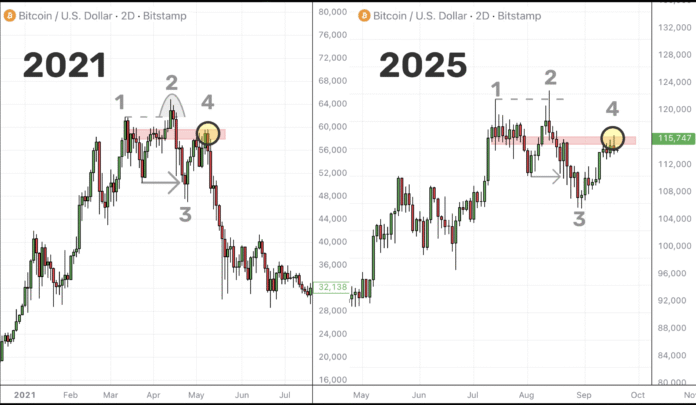
According to several analyses, Bitcoin’s price movement in 2021 may hold the key to understanding its current trajectory. The crypto analyst Reflection indicates that BTC staged a sharp rally in 2021 to record heights, followed by a blow-off top, a correction in the middle class, and finally a failed retest. This sequence of movements resulted in a 50% crash, sending Bitcoin from almost $69,000 to around $32,000 in just a few weeks.
BTC/USD two-day price chart. Source: Reflection/TradingView
The 2025 structure of Bitcoin now reflects the same four-stage process, with BTC just below a similar distribution zone that marked the bear market in 2021. If the fractal applies, the cryptocurrency risks a similar rejection. In the weekly chart, Bitcoin has broken under an increasing wedge, a bearish formation of higher highs and higher lows within a narrowing range.
BTC/USD Weekly Price Chart. Source: TradingView
Bitcoin’s Potential Price Targets
The collapse increases the risk of a decline to the $60,000 to $62,000 zone, which overlaps the 200-week exponential moving average (200-week EMA; blue wave). Some analysts even predict that the BTC price will drop to $50,000. Remarkably, a similar wedge collapse in 2021 triggered a 55% correction to the same 200-week EMA support.
However, not everyone expects a wider decline on the Bitcoin market. Trader Jesse emphasizes a cluster formed by BTC’s 200-day and exponential moving averages, which serve as support during the bull market.
BTC/USD Daily Price Chart. Source: Jesse/TradingView
From Friday, this EMA price floor was around $104,000 to $106,000. The analyst Bitbull says that Bitcoin is still far from a real cycle top and indicates that the US business cycle, a broad measure of economic dynamics, has not yet reached its peak, which normally happens before markets turn bearish.
BTC/USD Weekly Price Chart. Source: Bitbull/TradingView
Since the Federal Reserve is now lowering interest rates, Bitbull believes that crypto could still have three to four months ahead of a potential “blow-off top”. Signs of a bullish continuation strengthen the case for Bitcoin, which, according to analyst Captain Faibik, increases to $140,000.
BTC/USD Daily Price Chart. Source: Captain Faibik/TradingView
Faibik indicates the development of a potential bull flag. In this case, a decisive change above the resistance zone of $113,000 could confirm the breakout and open the door for a rally to $140,000 in the coming months. Many analysts have predicted similar destinations for Bitcoin in the past, and some favored macro-BTC peaks in the range of $150,000 to $200,000.
This article does not contain investment advice or recommendations. Every investment and trade movement involves risk, and readers should conduct their own research before making a decision. For more information, visit https://cointelegraph.com/news/bitcoin-60k-or-140k-traders-at-odds-where-btc-price-goes?utm_source=rss_feed&utm_medium=rss_category_market-analysis&utm_campaign=rss_partner_inbound

