The XRP price is currently facing a critical juncture, struggling to reclaim the 200-day moving average, which is increasing the chances of a possible rejection towards the upper $2 timeframe support if resistance continues. This development has significant implications for investors and market analysts, as it may indicate a deeper correction before a potential bullish recovery occurs.
Current Market Dynamics
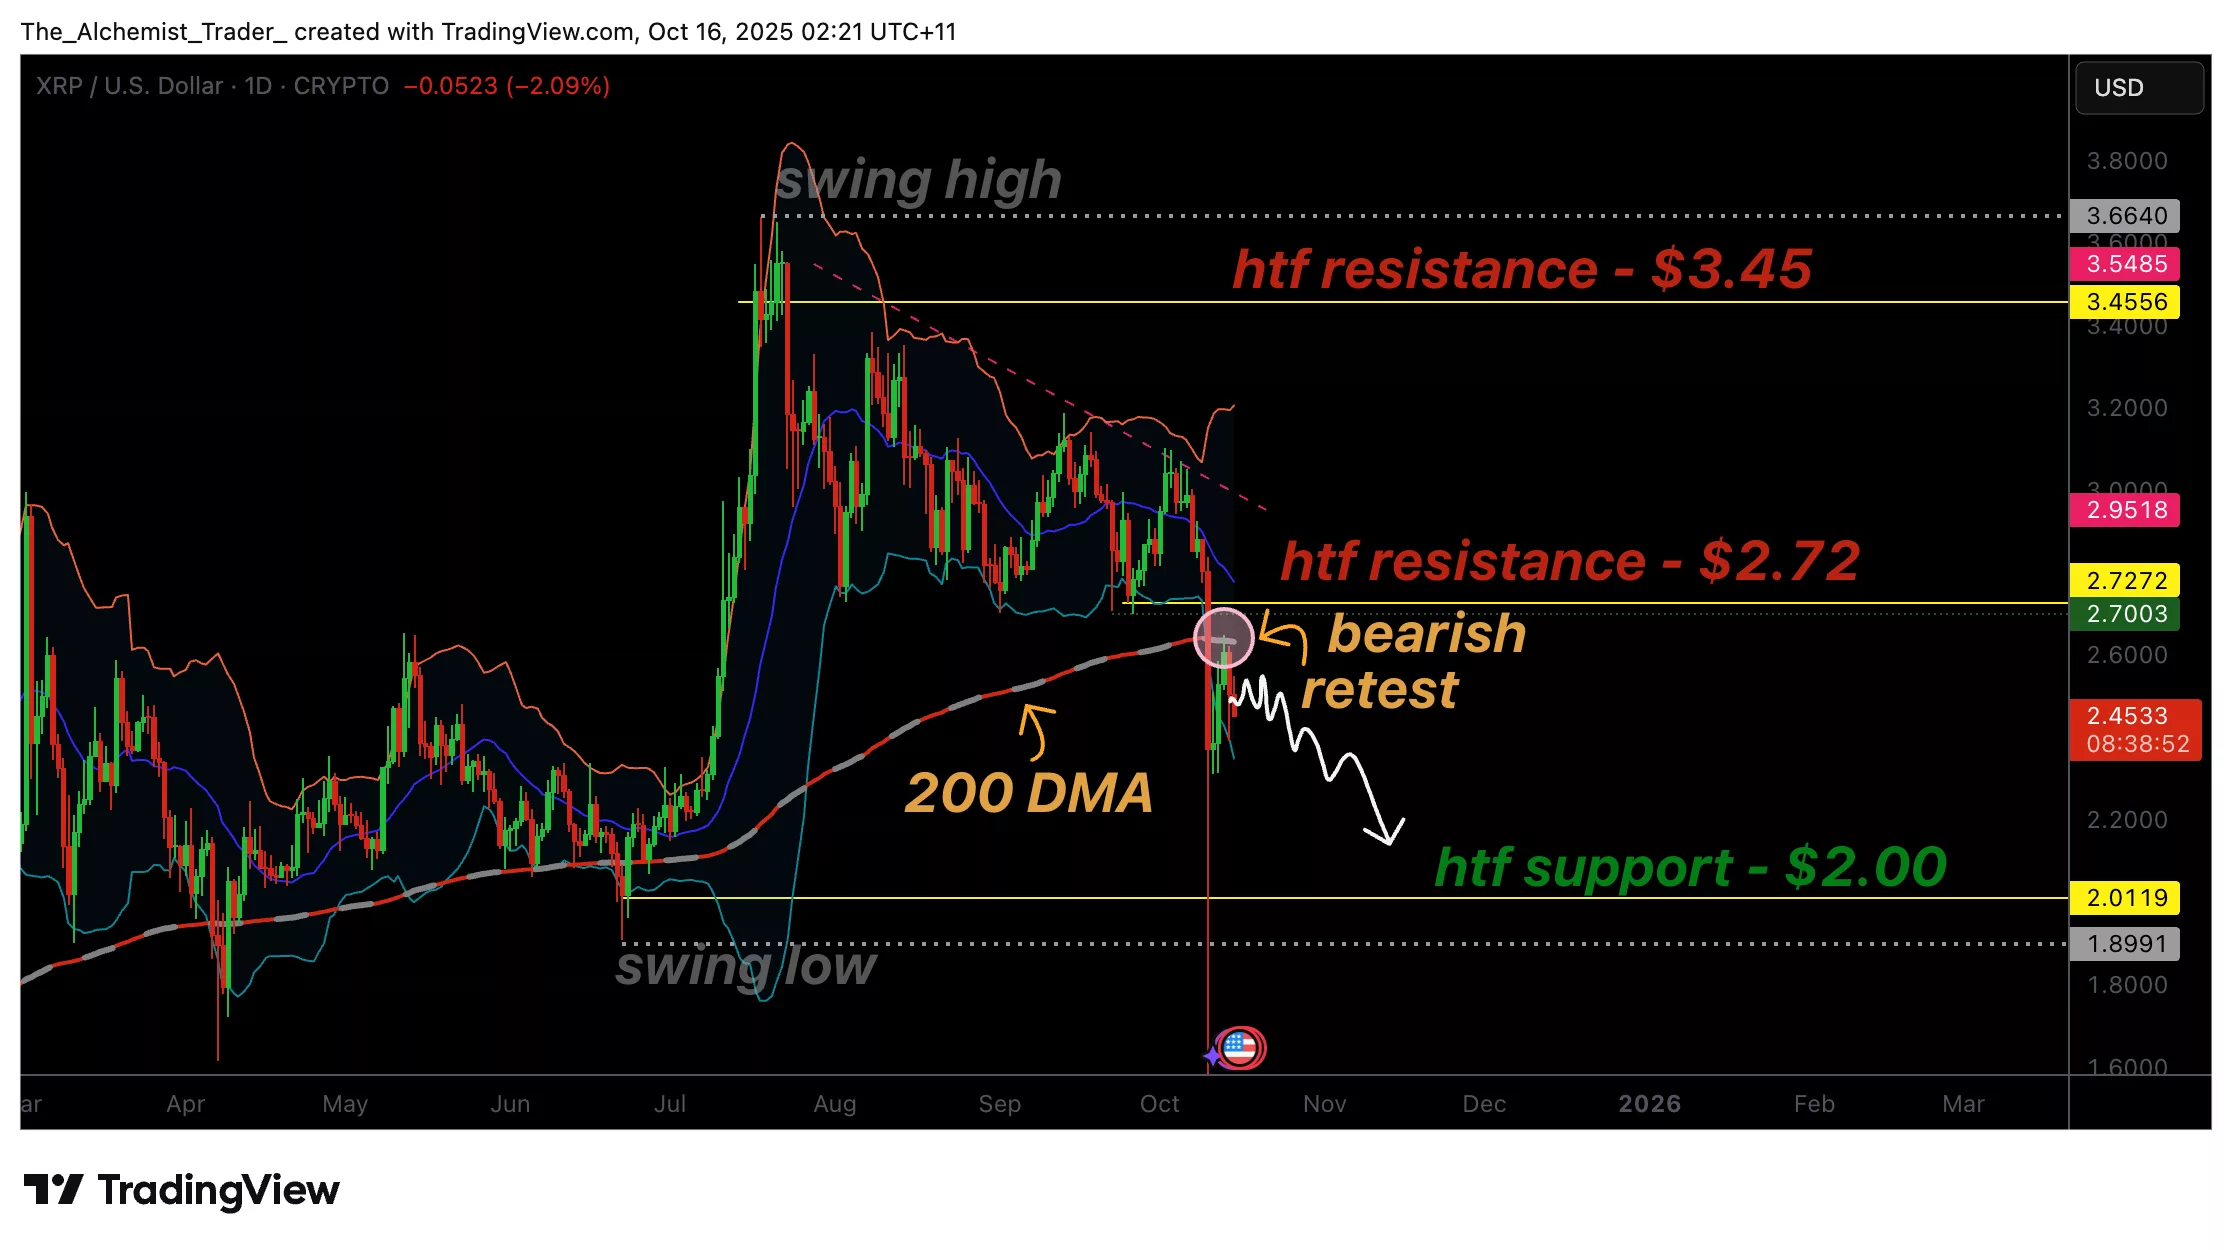
After a series of volatile moves in the broader market, XRP (XRP) price has failed to reclaim a critical resistance level represented by its 200-day moving average. This area remains a key technical obstacle that has repeatedly limited upside momentum in previous cycles. The recent price action reflects both structural exhaustion and uncertainty as bulls attempt to maintain control above the psychological level of $2 while bears defend the 200-day moving average near $2.72.
The upcoming SEC decisions on spot XRP ETFs are also being closely watched by investors, as approvals could potentially reignite XRP’s weak price momentum. The interplay between these factors is complex, and understanding the key technical points about XRP price is crucial for making informed decisions.
Key Technical Points
Several key technical points are worth noting. Firstly, the 200-day moving average is in line with high time-frame resistance at $2.72, presenting a significant barrier to upward movement. Secondly, the $2 area serves as structural support after capitulation, highlighting the importance of this level in maintaining bullish momentum. Lastly, the market structure indicates a failure to reclaim resistance, which could confirm a possible bearish retest setup.
 XRPUSDT (1D) chart, source: TradingView
The current price structure in XRP shows a textbook example of a bearish retest pattern. After testing and failing to close above the 200-day moving average, the market is showing early signs of rejection. This dynamic is significant because it shows a loss of bullish continuation strength in a region where accumulation and distribution phases have historically been separate.
Future Price Development
If XRP continues to close below the $2.72 resistance level and fails to reclaim the 200-day moving average, the market could see a decline back towards $2. This area is expected to act as strong support again, but failure to hold it could open the door for a deeper correction towards lower time frame levels. Conversely, a breakout and confirmed close above $2.72 would negate the bearish setup and could reignite bullish momentum towards the $3 region in the medium term.
For investors looking to stay ahead of the curve, it’s essential to monitor these developments closely and consider multiple sources of information. The relationship between XRP’s price movements and broader market trends is complex, and staying informed is key to making strategic decisions. For more information and the latest updates on XRP and other cryptocurrencies, visit https://crypto.news/xrp-price-struggles-at-the-200-day-moving-average-as-rejection-risks-grow/.

