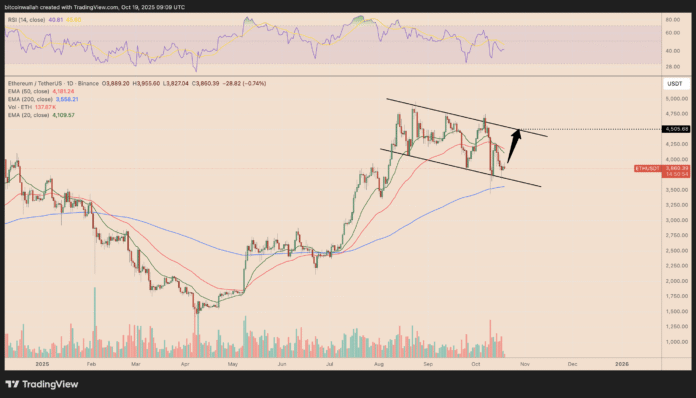
Ethereum’s native token, Ether (ETH), has made a significant recovery, rebounding over 15% from its two-month low of $3,435. This resurgence has led to multiple indicators suggesting that ETH could extend its rally towards $4,500 by the end of October. The recent price action has formed a bull flag pattern, a structure that often signals the continuation of! a prevailing uptrend after a brief consolidation.
Technical Analysis of ETH Price Movement
The bull flag is represented by a descending parallel channel that develops after the strong rebound from its April low at around $2,500 to the August high at around $4,950, as shown below.
ETH/USDT daily chart. Source: TradingView
The recent bounce from the channel’s lower boundary near $3,500 coincides with support from the 200-day exponential moving average (200-day EMA; the blue wave), a level that has attracted dip buyers during bull markets in the past. If the recovery momentum continues, ETH could aim for a breakout towards the upper boundary of the channel, around the $4,450-$4,500 area, in October.
Ethereum Price Prediction Based on MVRV Bands
Ethereum’s MVRV extreme divergence price bands show that the recent decline has stabilized near the middle band around $3,900, a level that has served as a springboard for new rallies in the past. Each time ETH has bounced off this mean, including early 2021, mid-2023, and early 2024, it has advanced towards the +1σ (standard deviation) band and is currently around $5,000.
Ethereum MVRV price bands with extreme deviation. Source: Glassnode
This structure suggests that ETH remains in the “healthy correction” phase of its ongoing bull cycle rather than signaling exhaustion. A push towards the $4,500-$5,000 zone by the end of October appears statistically likely if the middle level continues to act as support. Analysts such as FOUR and Luca have also shared their insights, with FOUR’s double-bottom technical setup showing ETH price reaching the structure’s neckline resistance at $4,750 in the coming days.
Source: X
Meanwhile, a breakout above this area could push the price towards the bull flag target above $5,200, a potential record high, by November.
ETH/USDT daily chart. Source: TradingView
A break below the confluence of support, the lower boundary of the bull flag and the 200-day EMA support (the blue wave) at around $3,550 could invalidate the pattern and expose ETH to deeper retracements towards $3,000-$3,200.
For more information on Ethereum’s price movement and analysis, visit https://cointelegraph.com/news/can-ethereum-price-reclaim-4500-in-october?utm_source=rss_feed&utm_medium=rss_category_market-analysis&utm_campaign=rss_partner_inbound

