The cryptocurrency market has experienced a significant downturn, with Ether (ETH) prices plummeting to $3,055, resulting in $1.3 billion in long liquidations on exchanges. This substantial decline has led to a notable imbalance between long and short positions, setting the stage for a potential short squeeze. In this article, we will delve into the current state of the ETH market, exploring the key factors that could influence its future trajectory.
Market Analysis and Trends
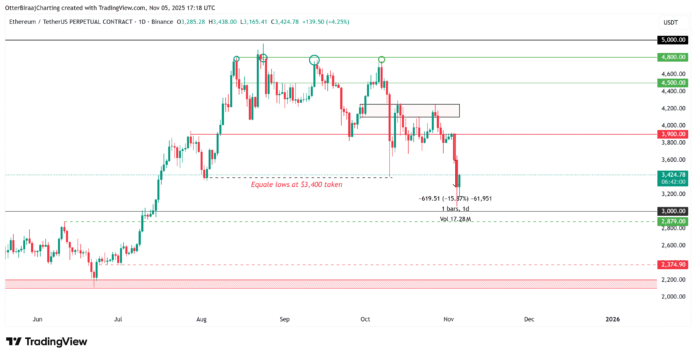
The recent drop in ETH’s price has pulled liquidity away from the $3,400 level, an area that had previously led to strong leverage building. The next major pocket of liquidity is now situated between $3,000 and $2,800, a level that has historically acted as long-term structural support. On Binance, over $39 million worth of long positions were liquidated during this correction, the largest since October 10th. Marketwide, total long liquidations have exceeded $1.3 billion, reshaping the derivatives landscape and creating a significant imbalance between long and short positions.
Ether’s one-day chart. Source: Cointelegraph/TradingView
Historical Market Phases and AVWAP Levels
According to CryptoQuant, Ether has gone through the four classic market phases on the weekly chart this year: decline, accumulation, premium, and distribution. During the bearish phase, ETH broke below several AVWAP (Anchored Volume-Weighted Average Price) levels, the dynamic support and resistance lines that measure the average price paid by buyers from specific starting points. The decline among key AVWAPs anchored by the Trump election victory, the first all-time highs (ATHs) of 2021 and 2024, and the July 2020 candle confirmed a seller-controlled market.
ETH then entered a 10-week accumulation phase between $2,000 and $3,000 before rising during the premium phase through the same AVWAPs and reaching a yearly high in August. However, the recent selling phase showed buyers losing control as ETH contracted between the AVWAPs from the ATH and $3,800 and then broke lower on high volume earlier this week. Currently, ETH is retesting long-term AVWAP support, suggesting that the correction may soon be exhausted.
Short Squeeze Setup and Hidden Bullish Divergence
With over $7 billion in short position liquidity around the $4,000 mark, ETH’s current decline has primed the market for a possible short squeeze. If price momentum reverses near the $3,000 support, even a modest rebound could trigger a cascade unwinding of overleveraged short positions, thereby accelerating a rally.
ETH exchange liquidation map. Source: CoinGlass
In addition to the bullish setup, ETH’s daily chart shows a hidden bullish divergence between the price and the Relative Strength Index (RSI), with the price making lower lows while the RSI holds equal lows, often signaling a trend reversal.
Hidden bullish divergence on Ether’s one-day chart. Source: Cointelegraph/TradingView
Crypto trader Daan Trades noted: “$ETH has completely rejected the previous cycle high and is now back at $2.8K-$4.1K. There is a good chance this changes before volatility spikes again.” As the market continues to evolve, it is essential to stay informed and adapt to the changing trends and analysis.
This article does not contain any investment advice or recommendations. Every investment and trading activity involves risks, and readers should conduct their own research when making their decision.
For more information and in-depth analysis, visit https://cointelegraph.com/news/eth-price-drop-to-dollar3k-sets-stage-for-dollar7b-short-squeeze-if-crypto-market-recovery-holds

