Solana Price Nears Bullish Breakout as First US Spot ETF Launches
Solana price is nearing a bullish breakout from a falling channel as its first US spot ETF goes live, driven by growing investor demand and institutional interest.
Summary of Key Points
- Solana price has risen 14% from its 7-day low, driven by the launch of its first US spot ETF.
- Investor demand has skyrocketed, with the token’s daily trading volume increasing by 5.4% to over $6.38 billion.
- SOL price action has formed a bullish reversal pattern over the past two months, with a potential breakout above $204.98.
According to data from crypto.news, Solana (SOL) price rose 14% from its October 23 low to an intraday high of $204.48 late Monday before settling at $202.25 at press time. Despite this, the token is still around 20% below its September high of $252.78. The launch of the first US spot Solana ETF by asset manager Bitwise on October 28 has contributed to the price surge, with the fund listed on the NYSE Arca under the ticker symbol BSOL.
The fund offers 100% direct exposure to SOL and includes staking functionality, setting it apart from traditional spot ETFs. This launch could pave the way for greater institutional accessibility for Solana, potentially increasing long-term engagement and investor interest in the token. As reported by Coinglass, almost $1 billion worth of SOL tokens were withdrawn from exchanges in the last 48 hours, indicating growing investor demand.
Meanwhile, Solana’s price has also found support from growing institutional interest, with several firms starting to add SOL to their digital asset holdings. On October 27, Reliance Global Group, a Nasdaq-listed company, announced that it had added Solana to its digital asset treasury, joining the likes of Bitcoin (BTC) and Ethereum (ETH). Such accumulation by a listed company underpins Solana’s emergence as an institutional asset, potentially providing a solid foundation for a sustained uptrend in the coming months.
Technical Analysis
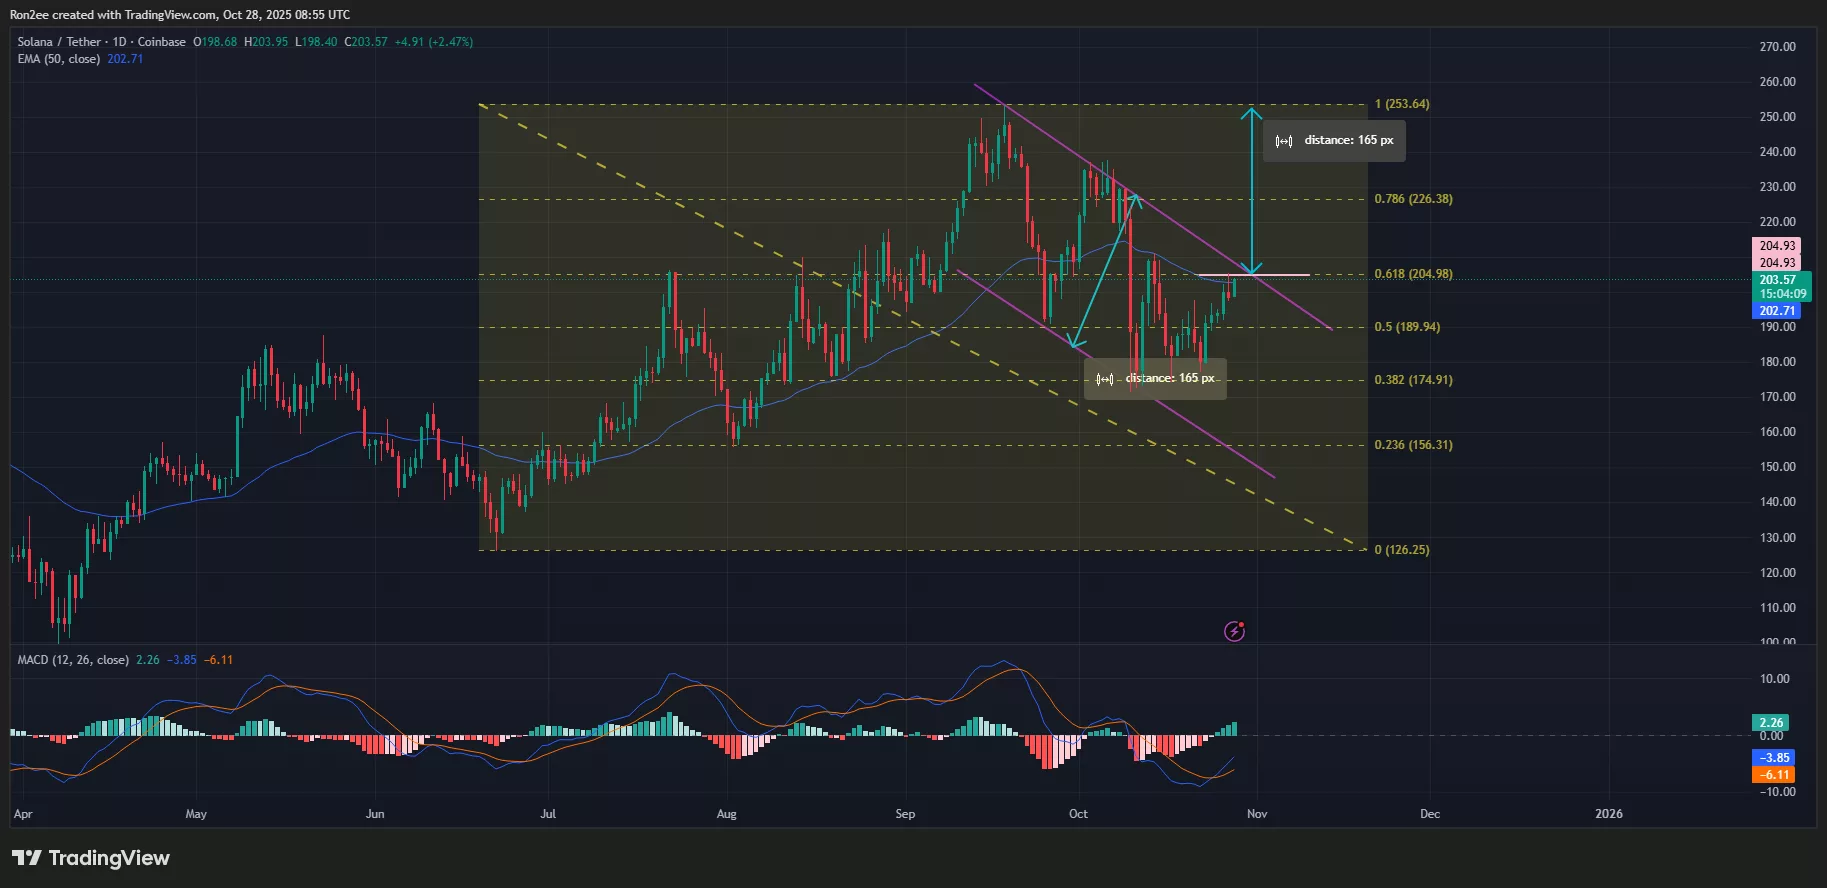
On the daily chart, Solana price is awaiting a bullish breakout from a falling channel that has developed over the past two months. The pattern features lower highs and lower lows within two parallel descending trend lines, signaling a possible trend reversal in favor of the bulls. Currently, the key resistance level lies at the 61.8% Fibonacci retracement at $204.98, a crucial area that also coincides with the neckline of the double bottom pattern forming within the structure.
 Solana price tests the upper trendline of a falling channel pattern – Oct 28 | Source: crypto.news
A decisive breakout above this area could open a rally towards $226.38, the 78.6% retracement level, and possibly up to $252.78, the September high, an increase of almost 23% from the current price. The momentum indicators seem to be in favor of the bulls, with the MACD recently forming a bullish crossover with the signal line, suggesting that bullish momentum is starting to build.
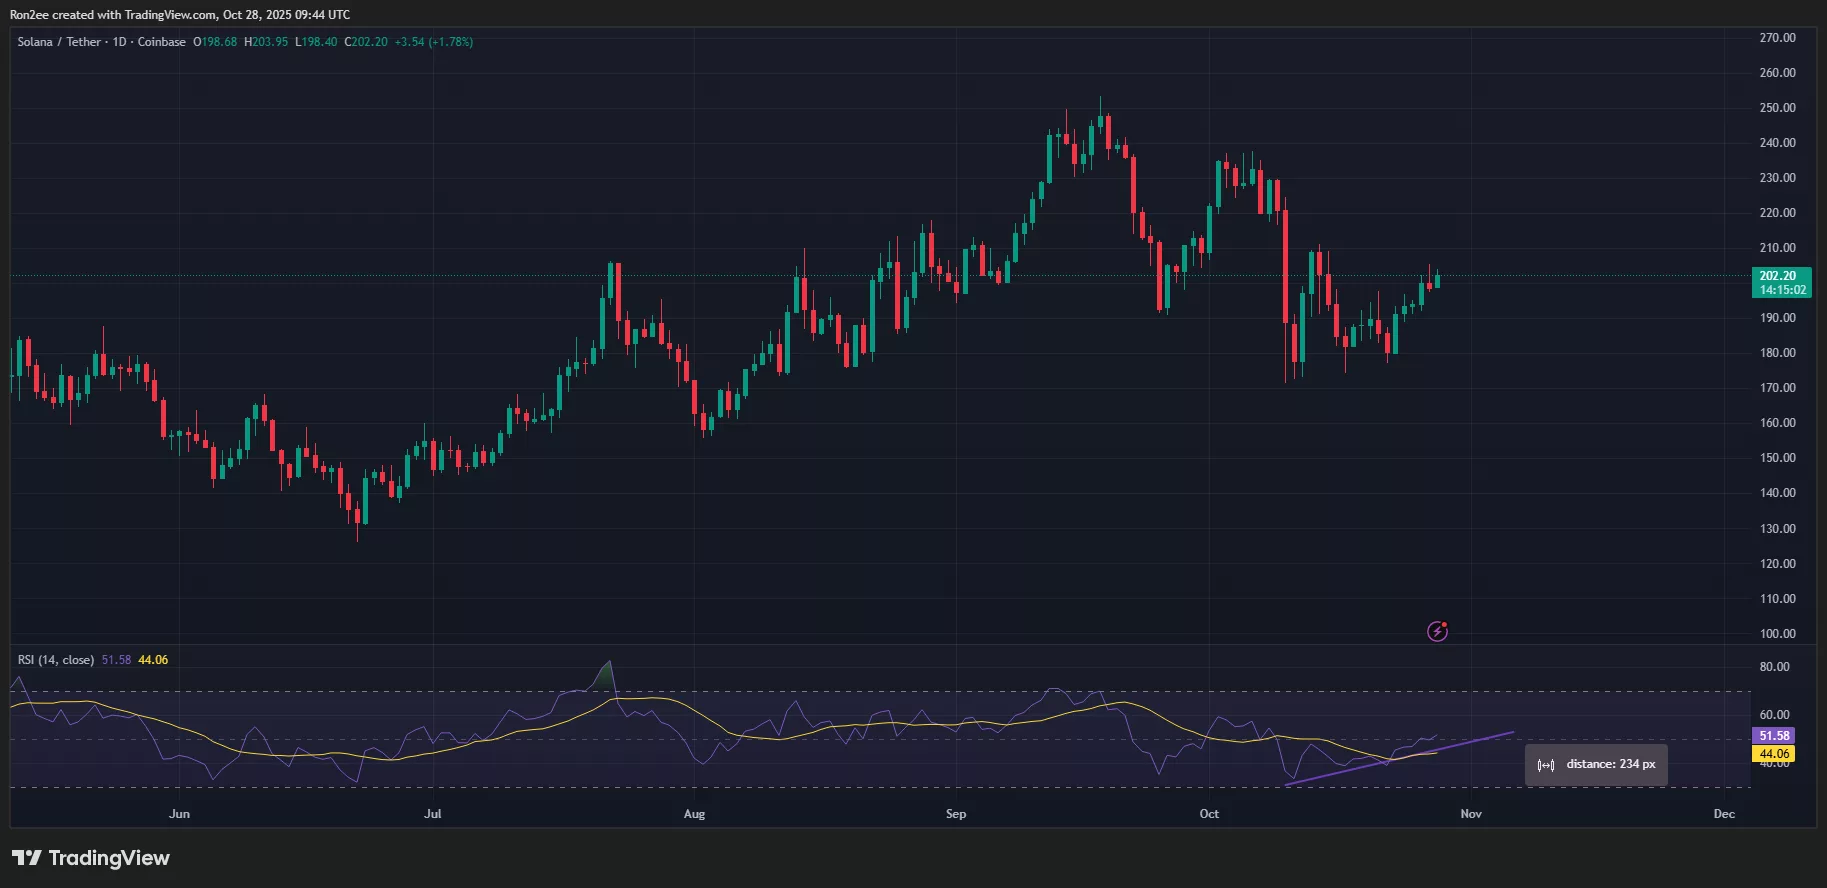
 Solana RSI has formed a bullish divergence – Oct 28 | Source: crypto.news
If bulls fail to maintain the momentum, support is expected around $189.94, the 50% Fibonacci level. A fall below could likely see Solana drop to $174.91, where buyers could intervene again. For more information, visit the original article at https://crypto.news/can-solana-price-recover-back-above-250-on-etf-launch-hype/
Disclosure: This article does not constitute investment advice. The content and materials presented on this site are for educational purposes only.

