Introduction to Cryptocurrency Market Trends
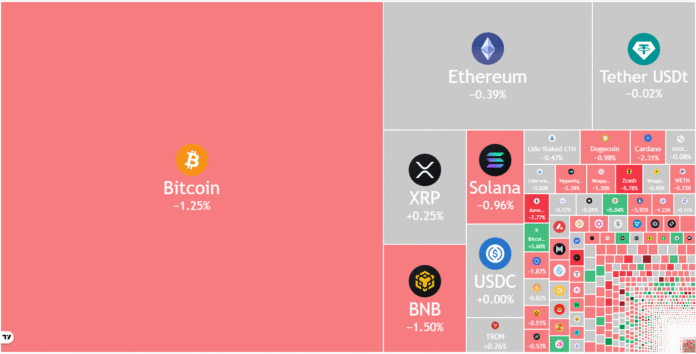
The cryptocurrency market has been experiencing a decline, with Bitcoin’s (BTC) price attempting a recovery earlier in the week but facing selling pressure at higher levels. This has led to outflows from crypto ETPs for three consecutive weeks, indicating negative sentiment among investors. Several altcoins are also struggling to initiate a recovery, suggesting a lack of demand from buyers.
Market Sentiment and Predictions
Despite the current downturn, some analysts believe that the market will soon bottom out and the worst is over. Bitwise CEO Hunter Horsley stated that BTC has been in a bear market for six months and is about to end, adding that the environment for crypto “has never been stronger.” However, crypto sentiment platform Santiment warned that “real bottoms often occur when the majority expects further price declines,” rather than when there is consensus on a “specific price bottom.”
Daily view of crypto market data. Source: TradingView
Cryptocurrency Investment Products
Traders should keep an eye on crypto investment products, which have seen outflows totaling $3.2 billion in three consecutive weeks. According to a report from CoinShares, there were $2 billion in outflows last week alone, the largest weekly outflows since February. Sustainable buying of crypto ETPs is required for a meaningful recovery.
Price Predictions for Major Cryptocurrencies
Could BTC continue its decline and drag altcoins lower, or is a recovery just around the corner? To find out, let’s analyze the charts of the top 10 cryptocurrencies.
S&P 500 Index Price Prediction
The S&P 500 Index (SPX) has formed a symmetrical triangle pattern, indicating indecision between bulls and bears.
SPX daily chart. Source: Cointelegraph/TradingView
If the price trends lower and breaks below the support line, it will signal the start of a deeper correction towards 6,550 and then 6,400. The pattern target for the triangle breakout is 6,276.
US Dollar Index Price Prediction
The US Dollar Index (DXY) turned lower from the overhead resistance at 100.50 on November 5 but is finding support at the 20-day exponential moving average (99.32).
DXY daily chart. Source: Cointelegraph/TradingView
If the price bounces sharply from the 20-day EMA, the probability of a break above the 100.50 level increases. The index could then rise to the 102 level, where the bears are once again expected to mount a strong defense.
Bitcoin Price Prediction
Bitcoin (BTC) is trying to find support at the $93,000 level, but the lack of a solid recovery suggests that bears continue to apply pressure.
BTC/USDT daily chart. Source: Cointelegraph/TradingView
Any recovery attempt is expected to be met with selling at the psychological level of $100,000. If the price drops from $100,000, it will indicate that the bears have converted the level into resistance. This increases the risk of a decline to $87,800 and then to $83,000.
Ether Price Prediction
Ether (ETH) traded below the breakout level of $3,350, but the bears failed to bring the price below $3,000.
ETH/USDT daily chart. Source: Cointelegraph/TradingView
The ETH/USDT pair could rise to the 20-day EMA ($3,444) where bears are expected to sell aggressively. If the price diverges sharply from the 20-day EMA, the pair risks falling below $3,000. In this case, the Ether price could fall to $2,500.
XRP Price Prediction
XRP (XRP) has fallen within a descending channel pattern, suggesting bears continue to sell on rallies.
XRP/USDT daily chart. Source: Cointelegraph/TradingView
There is minor support at $2.15, but if the level breaks, the XRP/USDT pair could crash to the channel’s support line. Buyers are expected to aggressively defend the support line as a break below could send the pair lower to $1.61.
BNB Price Prediction
BNB (BNB) is trying to stay above the $860 level, but the recovery is expected to face selling at the 20-day EMA ($983).
BNB/USDT daily chart. Source: Cointelegraph/TradingView
If the price drops sharply from the 20-day EMA, the bears will once again attempt to push the BNB/USDT pair below the $860 level. If they succeed, the BNB price could collapse to $730.
Solana Price Prediction
Solana (SOL) is gradually sliding towards solid support at $126, suggesting that bears remain in control.
SOL/USDT daily chart. Source: Cointelegraph/TradingView
Any recovery attempt is likely to face selling at the 20-day EMA ($159). If the price drops sharply from the 20-day EMA, the risk of a break below $126 increases. The Solana price could then fall to $95.
Dogecoin Price Prediction
Dogecoin (DOGE) is trying to reach support near $0.15, but bulls are struggling to mount a strong recovery.
DOGE/USDT daily chart. Source: Cointelegraph/TradingView
If the price diverges from the 20-day EMA ($0.17), the probability of a decline to $0.14 increases. Buyers are expected to defend the $0.14 level with all their might as a break below could send the Dogecoin price down to $0.10.
Cardano Price Prediction
Cardano (ADA) fell below the $0.50 support on Friday, suggesting that bears continue to be in charge.
ADA/USDT daily chart. Source: Cointelegraph/TradingView
Bulls are attempting to push Cardano price back above the $0.50 breakout level. If they succeed, the ADA/USDT pair could rise to the 20-day EMA ($0.55). Sellers will try to stop the recovery at the 20-day EMA. In this case, the bears will try to extend the decline to $0.40.
Hyperliquid Price Prediction
Hyperliquid (HYPE) has been trading between the 50-day SMA ($41.78) and the $35.50 support over the past few days.
HYPE/USDT daily chart. Source: Cointelegraph/TradingView
This trade is expected to cul

