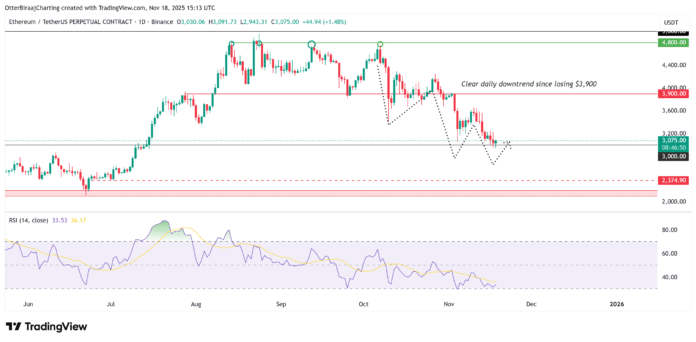
Ethereum’s native token, Ether (ETH), has experienced a significant decline, slipping nearly 20% from $3,900 in November and retesting $3,000 on November 17, a price last seen on July 15. This downturn has pushed ETH into a well-defined daily downtrend characterized by consecutive lower highs and lower lows, putting the market in a technically fragile zone. However, long-term accumulation signals are emerging, which could potentially indicate a buying opportunity for investors.
Key Takeaways
The 20% monthly decline has put Ether in a clear daily downtrend and retested the $3,000 mark for the first time since July. When the Mayer multiple falls below 1, it indicates a historically strong accumulation zone reminiscent of past lows. Leveraged liquidity has reset, but clusters at $2,900 and $2,760 warn of further volatility ahead of a possible recovery.
Ether’s Price Decline and Accumulation Signals
One of the key signals indicating a potential buying opportunity comes from Capriole Investments’ Mayer Multiple (MM), which measures the relationship between ETH’s current price and its 200-day moving average. A value below 1 suggests that Ether is trading at a discount to its long-term trend and has historically aligned with major accumulation zones. Ether one-day chart. Source: Cointelegraph/TradingView
ETH’s Mayer Multiplier falls below 1 for the first time since mid-June and is now back in the “buy zone”, an area that previously preceded strong multi-month recoveries. Throughout ETH history, readings below 1 have typically indicated long-term lows, with the biggest exception being January 2022, when the indicator remained suppressed due to the start of a broader bear market. Ether’s Mayer Multiple fell below 1. Source: Capriole Investments
Liquidity Resets and Volatility
Despite macroeconomic accumulation, short-term price developments remain vulnerable. Data from Hyblock Capital shows that even after clearing the key psychological zone of $3,000, ETH is still above several dense clusters with long-term liquidation. “We’ve swept quite a few large (bright) long liq clusters. The next two down on ETH are $2,904-$2,916 and $2,760-$2,772,” Hyblock wrote, suggesting the market may need a deeper flush of liquidity before forming a durable base. ETH long liquidity clusters below $3,000. Source: Hyblock Capital/X
Additionally, analytics platform Altcoin Vector highlighted that Ether’s entire liquidity structure has “completely reset,” a condition that has existed before every major bottom in the past. According to the platform, liquidity collapses are more likely to precede periods of low points lasting several weeks than immediate structural collapses. Ether Liquidity Index. Source: Altcoin Vector/X
This article does not contain any investment advice or recommendations. Every investment and trading activity involves risks, and readers should conduct their own research when making their decision. For more information, visit https://cointelegraph.com/news/eth-falls-into-buy-zone-but-volatility-adverse-traders-take-a-wait-and-see-approach?utm_source=rss_feed&utm_medium=rss_category_market-analysis&utm_campaign=rss_partner_inbound

