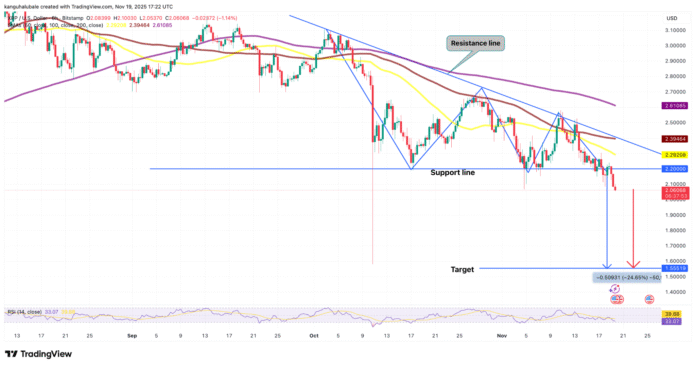
XRP, the fourth-largest cryptocurrency by market capitalization, is facing a potential price drop of 25% to $1.55 due to a bearish descending triangle pattern and increasing bearish momentum. The cryptocurrency’s price has been trading 11% below its value a week ago, and several data points suggest a deeper correction is on the horizon.
XRP’s Descending Triangle Pattern
The XRP price chart confirmed a descending triangle pattern on its eight-hour chart since falling below the psychological $3 mark in October. A descending triangle chart pattern is characterized by a flat support level and a downward-sloping resistance line, which dissolves when the price falls below the flat support level and falls around the maximum height of the triangle. The XRP/USD pair confirmed the descending triangle as it fell below the pattern’s support line at $2.20 on Monday.
XRP/USD eight-hour chart. Source: Cointelegraph/TradingView
Bulls are struggling to keep XRP above the $2 support. A break of this level will likely see XRP price decline toward the triangle’s measured target at $1.55 by the end of November, a 25% decline from current price levels. The Glassnode distribution heatmap shows a large supply cluster between $2.38 and $2.40, where nearly 3.23 billion XRP have been acquired, marking an area of strong resistance for XRP.
XRP/USD cost distribution heatmap. Source: Glassnode
XRP’s Bearish Divergence
XRP’s downtrend is supported by a bearish divergence between its price and the Relative Strength Index (RSI). The weekly chart shows that the XRP/USD pair rose between November 2024 and July 2025, forming higher highs within a rising channel. However, during the same period, the weekly RSI fell from 92 to 68 and formed lower highs.
XRP/USD weekly chart. Source: Cointelegraph/TradingView
A divergence between rising prices and a falling RSI usually indicates weakness in the prevailing uptrend, prompting traders to sell more at local highs as profit-taking increases and buyer exhaustion sets in. The RSI has since fallen to 39, suggesting that market conditions are still favoring a downtrend.
Declining XRP Ledger Network Activity
Network activity on the XRP ledger has remained subdued over the past four months. Onchain data from Glassnode shows that daily active addresses (DAAs) on the network are now well below the June 14 peak of 577,000 DAAs. Since there are only around 44,000 DAAs at the time of writing, user transactions have dropped significantly, perhaps indicating reduced interest or a lack of confidence in XRP’s short-term prospects.
Daily active XRP addresses. Source: Glassnode
The number of new addresses has also fallen from 13,500 on November 10 to the current 4,000 per day, indicating declining network adoption and user engagement. Historically, declines in network activity typically signal impending price stagnation or declines, as lower transaction volume reduces liquidity and buying momentum.
This article does not contain any investment advice or recommendations. Every investment and trading activity involves risks, and readers should conduct their own research when making their decision. For more information, visit https://cointelegraph.com/news/xrp-price-at-risk-of-a-25-drop-to-1-55-here-is-why?utm_source=rss_feed&utm_medium=rss_category_market-analysis&utm_campaign=rss_partner_inbound

