The world of Web3 is constantly evolving, and it’s essential to separate fact from fiction. While some sectors are gaining traction, others are struggling to deliver. In this article, we’ll delve into the latest data and trends to provide a reality check on the altcoin market.
Web3 Activity: A Shift in Sector Dominance
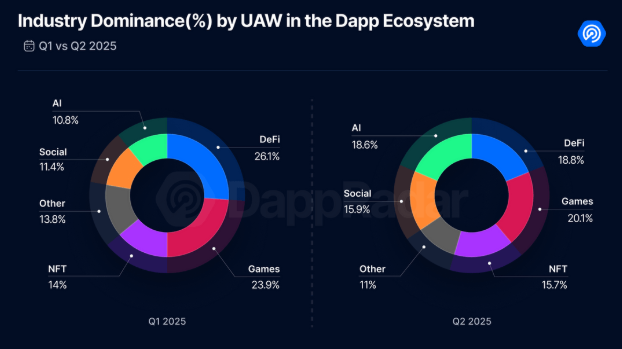
According to recent reports, the daily activity of Web3 was around 24 million in the second quarter of 2025. However, the composition of the sector has shifted significantly. Crypto gaming, once the largest category, now accounts for over 20% of the market share, down from its previous dominance. Defi, on the other hand, has slipped from over 26% to less than 19%.
In contrast, social and AI-related dapps are gaining traction. Farcaster leads the social category with around 40,000 daily unique active wallets (UAW), while AI-based protocols such as Virtuals Protocol (virtual) and attract 1,900 weekly UAW. The Dapp industry dominance of UAW is a clear indication of the shifting landscape.
Transaction counts show how often smart contracts are triggered, but can be inflated by bots or automation. Defi’s transaction footprint is paradoxical, with a user base that has decreased, but still generates more than 240 million weekly transactions – more than any other Web3 category.
Defi Attracts Big Players
Exchange-related activities add to Defi’s dominance, with crypto games and the “other” category trailing behind. The total value locked (TVL) tells an even stronger story, with Defi TVL reaching a 150% increase since January 2024, according to Defillama.
The deviation between increasing TVL and falling UAW reflects a key topic of this crypto cycle: institutionalization. The capital is focusing on fewer, larger wallets that now also contain funds. This trend is still young, as Defi is contrasted with regulatory uncertainties in many jurisdictions.
Other Applications Dominate Gas
Transaction data alone does not record the full Web3 image. The use of Ethereum gas can show where the economic and arithmetic weight really lies. Glassnode data shows that Defi, although it is the key sector of Ethereum, now only makes up 11% of its gas consumption.
The “other” category, which includes emerging areas such as the actual system for asset tokenization (RWA), decentralized physical infrastructure (depin), AI-based dapps, and other services, has risen to over 58%. RWA, in particular, is often referred to as one of the most promising cryptosectors, with a total RWA value increasing from $15.8 billion to $25.4 billion.
Do Prices Follow Web3 Stories?
The assets rarely move with the on-chain activity in lockstep. While a hype can drive short-term spikes, persistent profits correspond to aligning with sectors that deliver material usefulness and adoption. Last year, this meant infrastructure and earnings-focused projects that exceeded narrative pieces.
The coins of the Smart Contract platform made the strongest profits, with the top 10 uncovering 142% of HBAR (+360%) and XLM (+334%). Defi tokens also gave themselves well, achieving an average of 77% joy, with the curve dao (CRV) rising by 308% and pendle (pendle) by 110%.
In conclusion, Web3 investments remain concentrated on mature sectors, and the native currencies of leading smart contract platforms increase. Solid returns have also achieved income-focused Defi and RWA tokens. However, the sectors behind the most traded stories – AI, Depin, and Social – must still convert the attention into meaningful token gains.
This article serves general information purposes and should not be regarded as legal or investment advice. The views, thoughts, and opinions expressed here are solely those of the author and do not necessarily reflect the views and opinions of Cointelegraph or do not necessarily represent them.
Source: Cointelegraph

