Bitcoin’s Disappointing October: What’s Next for the Cryptocurrency Market?
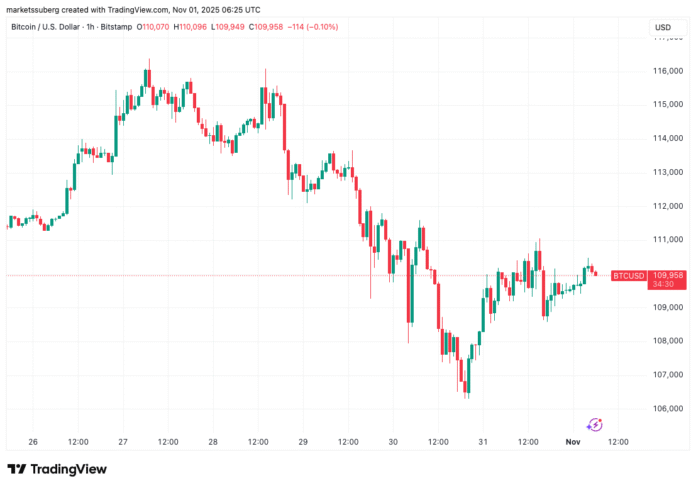
Bitcoin (BTC) has sealed its worst October performance since 2018, with traders adopting a cautious outlook on the cryptocurrency’s future. The BTC price traded around $110,000 on Saturday, recovering losses from Friday’s Wall Street trading session. According to data from Cointelegraph Markets Pro and TradingView, the BTC price has been experiencing sell pressure, involving both US exchanges and spot Bitcoin exchange-traded funds (ETFs).
BTC/USD one-hour chart. Source: Cointelegraph/TradingView
Weakness in Institutional Demand and Rising Sell Pressure
Onchain analytics platform Glassnode noted that ETF outflows highlight “rising sell pressure from TradFi investors and renewed weakness in institutional demand.” Data from UK-based investment company Farside Investors showed that Friday’s tally was $191 million, following $488 million in outflows for Thursday. This weakness in institutional demand has contributed to the downward trend in the BTC price.
US spot Bitcoin ETF netflows (screenshot). Source: Farside Investors
Despite the macro tailwind of an interest-rate cut from the US Federal Reserve, markets have shrugged off the positive news. The Fed delivered the expected rate cut, but the hawkish tone for December has cooled optimism, according to Glassnode. This shift in sentiment is reflected in BTC’s options market, with traders moving back into cautious mode.
Time-Based Capitulation and Volatility Ahead
Crypto investor and entrepreneur Ted Pillows described the current setup on Bitcoin as “time-based capitulation.” He warned that Bitcoin needs to consolidate above $100,000 to avoid a downtrend. A weekly close below this level will confirm the downtrend, according to Pillows.
BTC/USDT two-day chart. Source: Ted Pillows/X
Trader Daan Crypto Trades noted that a true move could only come once the BTC price decisively crosses the upper or lower boundary of its local range. The two key levels of interest are $107,000 and $116,000. He emphasized the need for patience, waiting for the range to end and momentum to return to the market.
Bollinger Bands Indicate Record Volatility Ahead
The October monthly candle delivered a disappointing 3.7% loss for BTC/USD, the worst result since 2018. Commentator Matthew Hyland discussed the topic, noting that the Bollinger Bands volatility indicator implies record volatility is on the way. “Monthly Bollinger Bands have reached the most extreme levels in Bitcoin’s entire history,” he wrote on X.
BTC/USD monthly returns (screenshot). Source: CoinGlass
BTC/USD one-month chart with Bollinger Bands data. Source: Matthew Hyland/X
This article does not contain investment advice or recommendations. Every investment and trading move involves risk, and readers should conduct their own research when making a decision. For more information, visit the original source.

