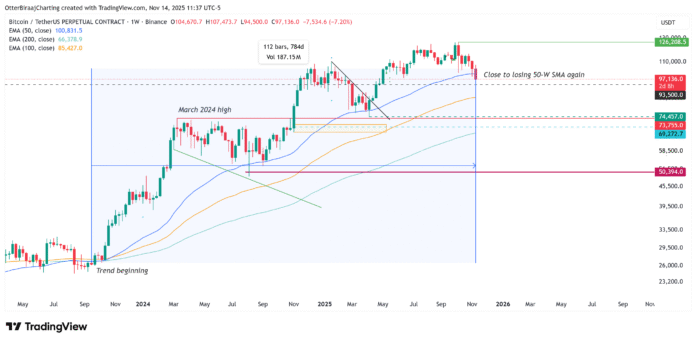
Bitcoin (BTC) has experienced a significant decline, breaking below its June support near $98,000 on Thursday, marking its first clear low-high-low structure on the daily chart since February. This downturn has deepened, with BTC slipping to $94,500, putting it within striking distance of its year-opening price of $93,500, a level that would completely wipe out its 2025 gains.
Key Takeaways and Market Analysis
The current market situation for Bitcoin is precarious, with several key indicators suggesting a potential collapse of its two-year trend. The data shows that all major short-term realized price ranges have turned into resistance, and short-term holders are facing near capitulation losses of 12.79%. Additionally, Bitcoin is at risk of closing below the 50-week SMA for the first time since 2023, breaking a two-year uptrend.
One-Week Bitcoin Analysis. Source: Cointelegraph/TradingView
A Two-Year Trend at Risk of Collapse
After defending the 50-week simple moving average (SMA) last week with a strong rally over the weekend, Bitcoin is back on track to close below the indicator unless the price rises back above $101,000 by Sunday. This level has acted as structural support since September 2023 and defines a two-year uptrend. A confirmed weekly close below this would not only negate this trend but would also suggest that BTC’s bullish momentum has weakened enough for a broader correction to take shape.
Bitcoin researcher Axel Adler Jr. noted the severity of the collapse, saying, “There is no support left in the market, all key metrics have turned into resistance,” after BTC lost $100,000 on November 14. The data shows that several price bands realized by short-term holders (STH), once reliable bounce zones, are now forming upper limits.
Bitcoin support and resistance are based on short-term realized price levels. Source: X
Possible Stabilization Zone
CryptoQuant CEO Ki-Young Ju pointed to a possible stabilization zone: the cost base for six- to 12-month holders is around $94,000. A rebound from this level could mark a technical bottom, but a decisive close below this level on a higher time frame risks accelerating losses and confirming a bear market.
Short-Term Pain and the Surrender Clock
Data from CryptoQuant showed that the drop below $98,000 caused acute stress among new and short-term participants. New investors are down 3.46%, while those who bought last month face a loss of 7.71%. Most importantly, the core group of short-term holders, buyers within the last six months, are now facing a significant loss of 12.79%.
Bitcoin age group realized profit and loss distribution. Source: CryptoQuant
This level of unrealized losses has historically accompanied periods of capitulation where reactive traders sell out of fear, exacerbating corrections but also clearing the way for stronger long-term holders. With short-term realized gains and losses falling 13%, the data suggests that the panic is nearing exhaustion, often the final stage before a more stable recovery structure forms.
This article does not contain any investment advice or recommendations. Every investment and trading activity involves risks, and readers should conduct their own research when making their decision.
For more information and the latest updates on Bitcoin’s market trends, visit https://cointelegraph.com/news/bitcoin-s-2-year-trend-is-about-to-collapse-is-90k-programmed

