


Breakout Trading: What Is It And How Does It Work?
Simply put, breakout trading is trying to enter a stock as it “breaks out” of its pattern or key level.
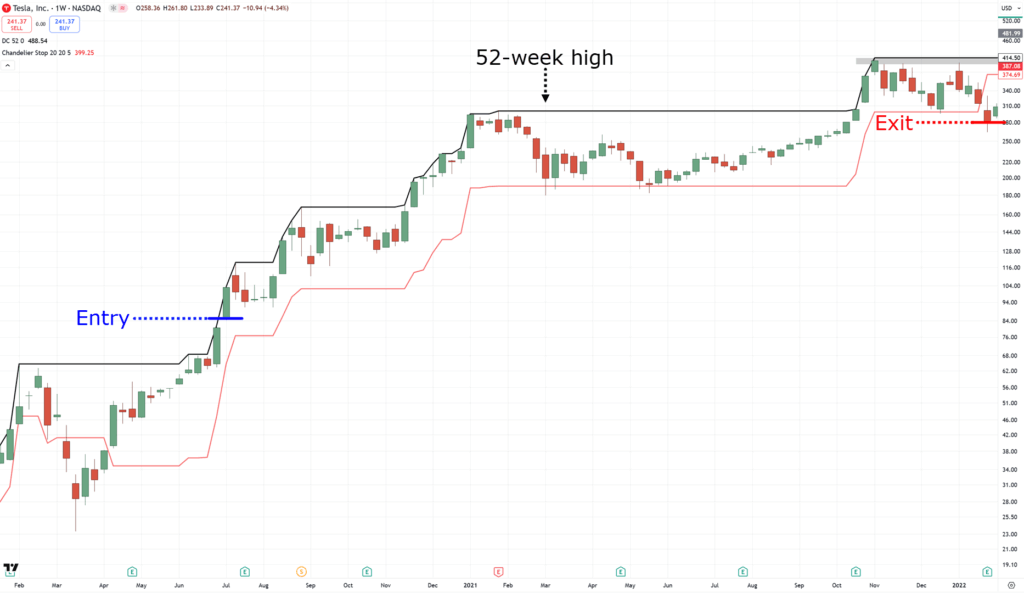
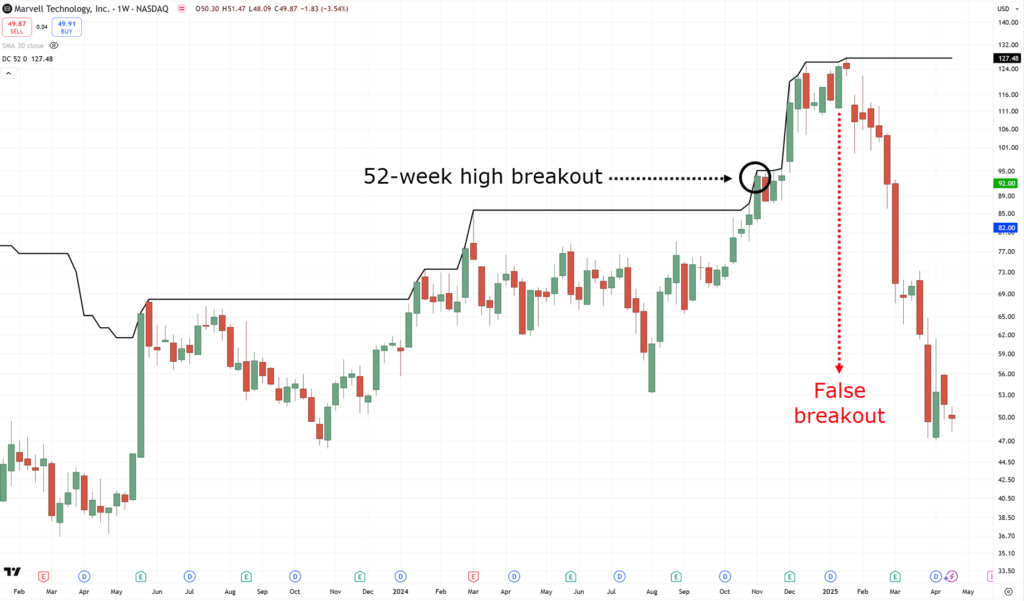
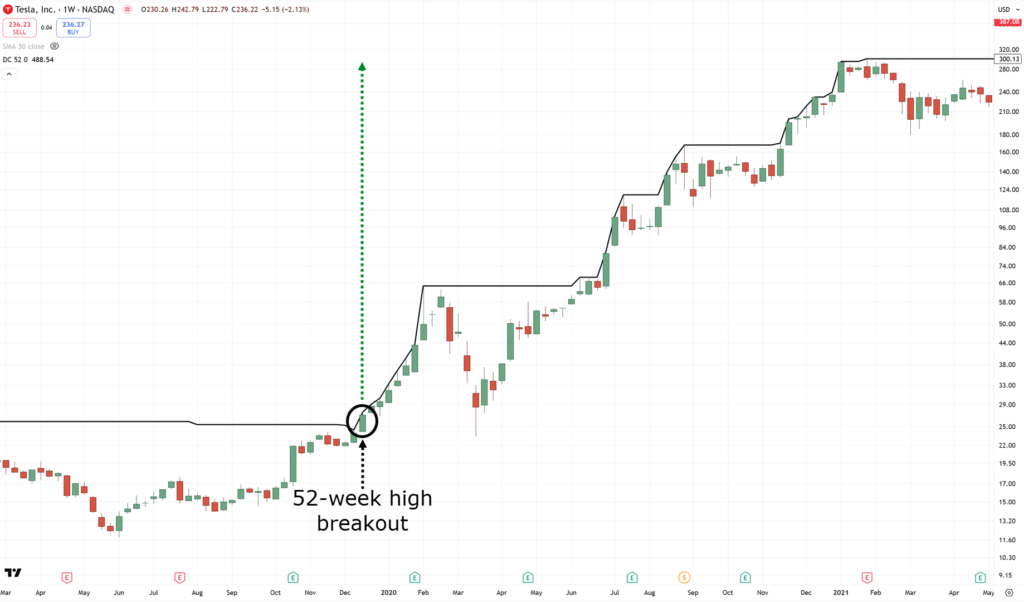
It can be entering a stock whenever it makes a 52-week high…
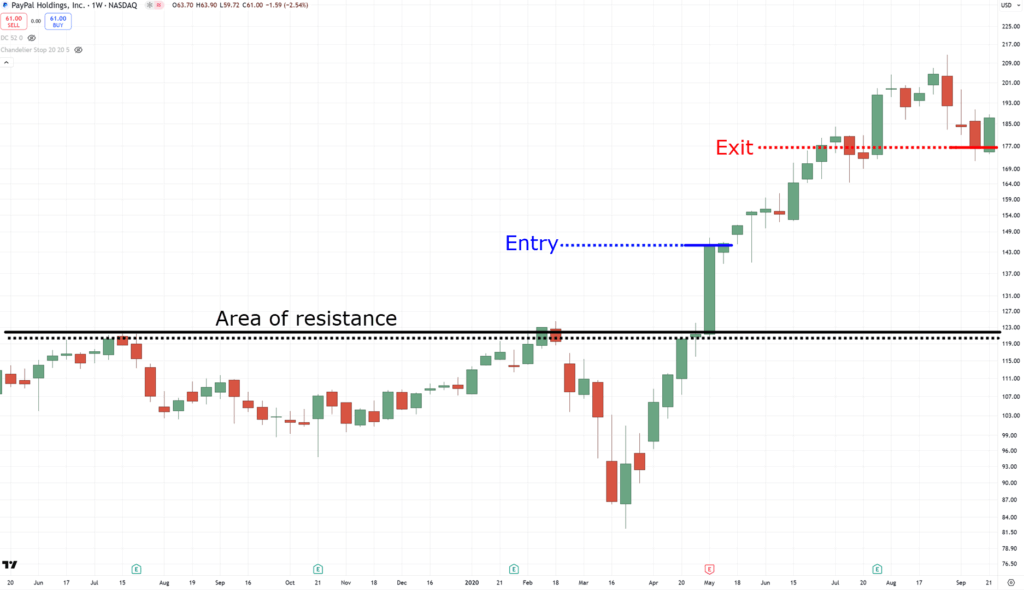
Or entering whenever it breaks out of its major area of resistance…
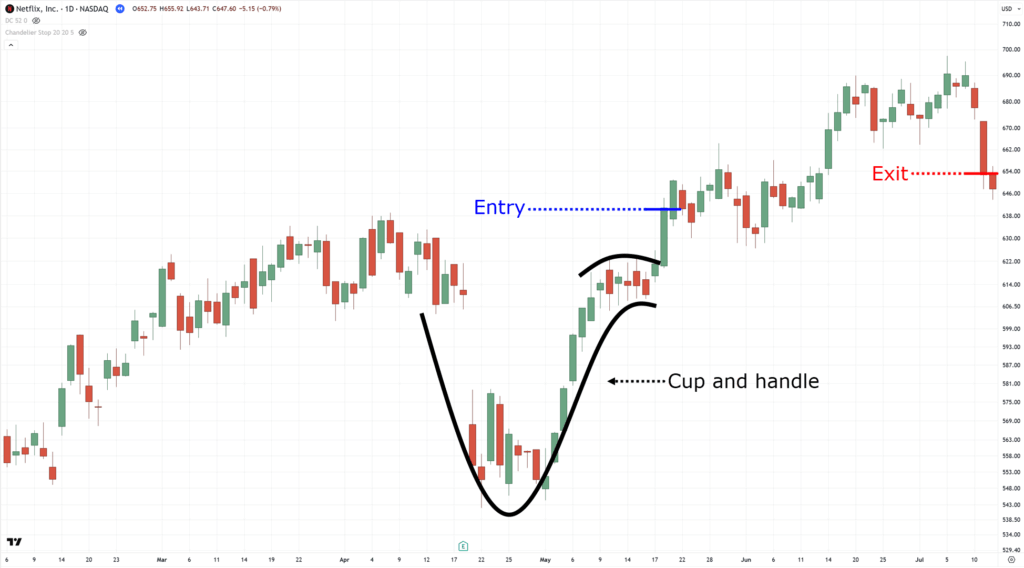
Or perhaps even as it breaks out of its cup and handle pattern…
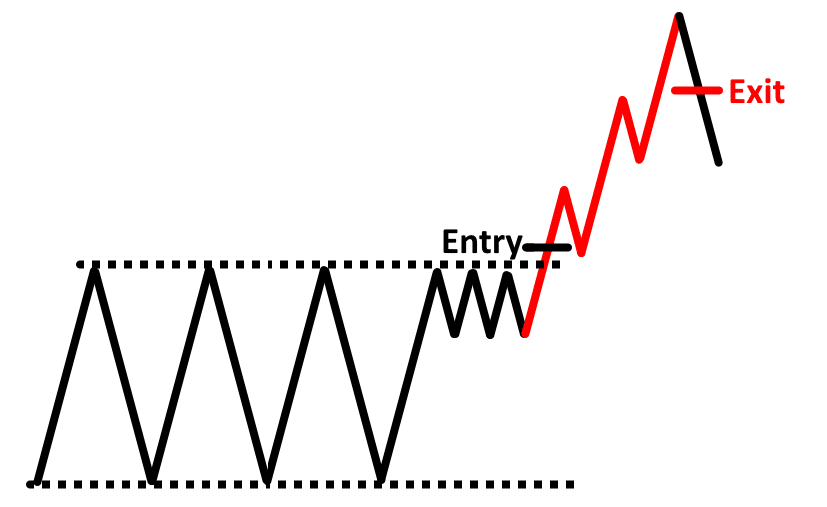
But while I’ve shared three concepts of how breakout trading works with you…
…they always have one recurring pattern:
Buying high and selling higher
I’m sure you’ve heard countless times from other traders.
“Make sure to buy when a stock is oversold!”
“Buy low and sell high!”
“Buy when others are fearful, and sell when others are greedy!”
While those statements have their merits, they also carry the risk of buying against the current momentum!…
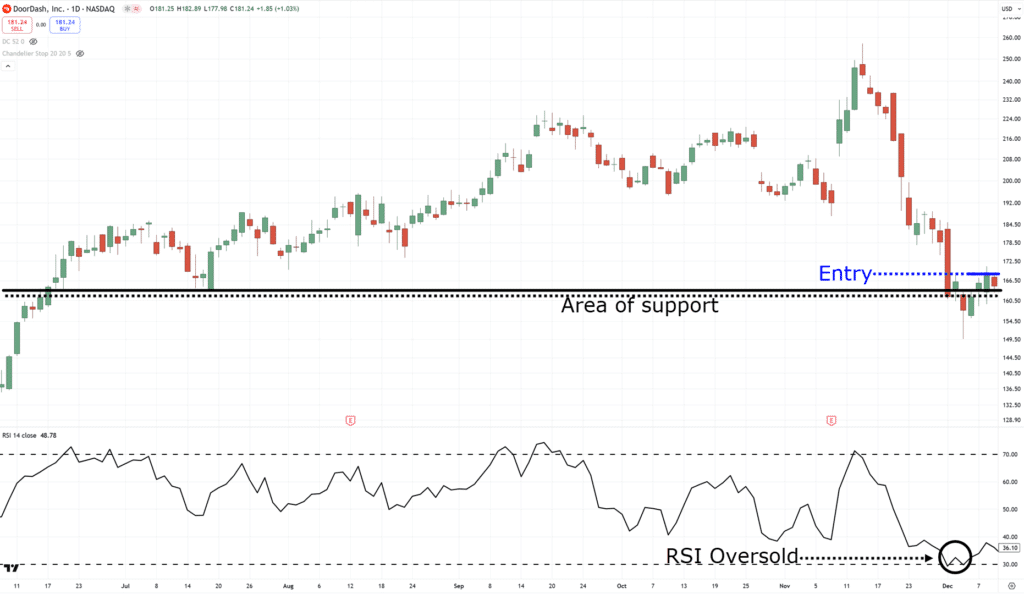
It’s like catching a falling knife or getting your gut punched into the ground like an anime character….

In hindsight, indeed, the market can potentially offer great rewards when buying low and selling high.
But even when buying low on a stock, it can sometimes go even lower…
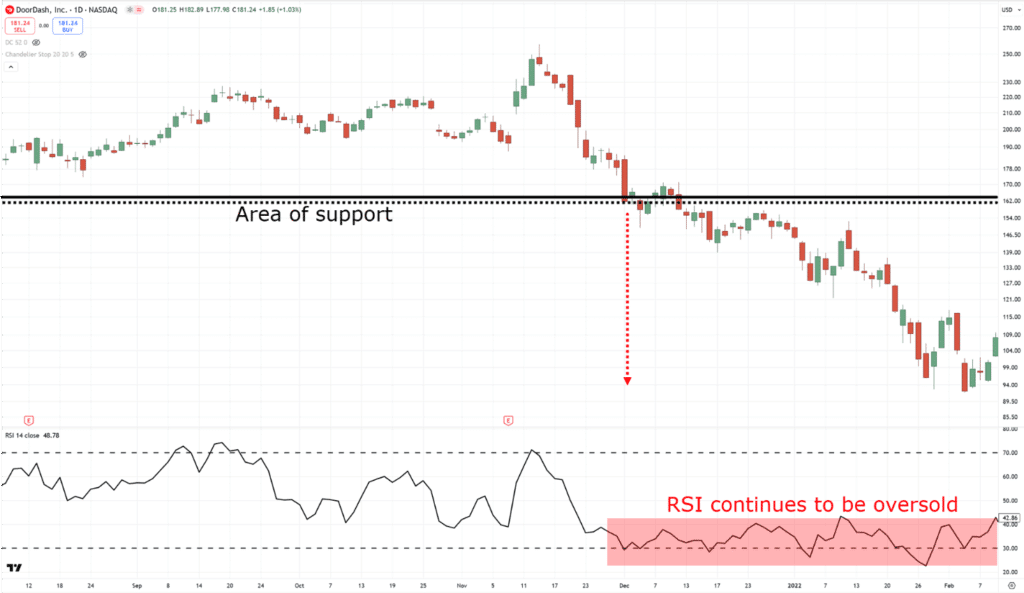
Can your gut take that kind of punch!?
This is where breakout trading has its advantages.
Why breakout trading?
For one, you’re not going against the market’s momentum.
You’re trying to “ride” a trend going in a certain direction.
In fact, these trends can sometimes last for months or even years…
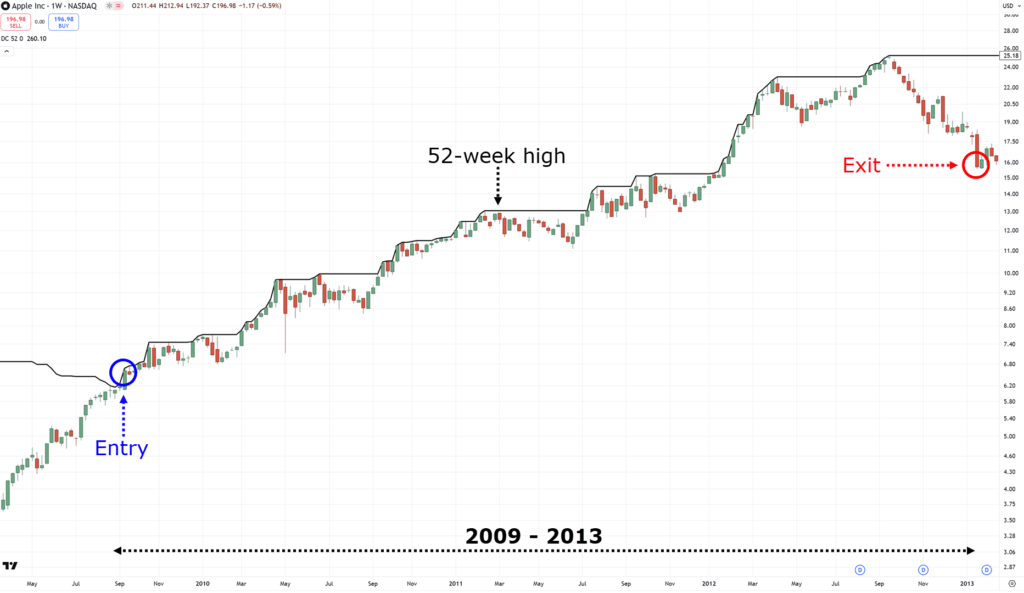
This can allow you to capture monster moves in the market
But of course, breakout trading has its downsides, as any system does
For example, there are times when a breakout can turn into “false breakouts.”…
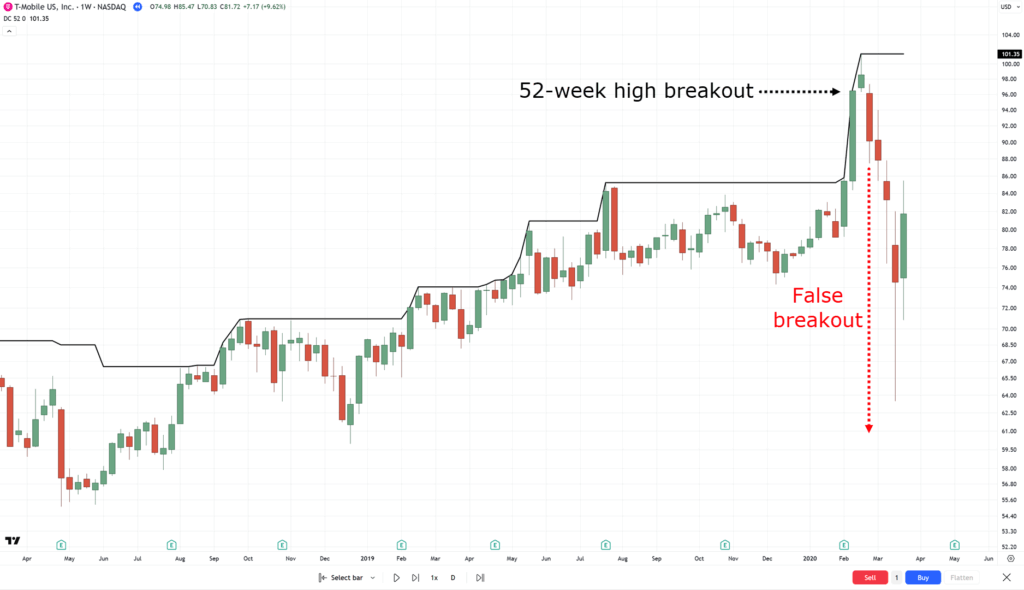
So, nothing is flawless!
At this point, you might be thinking:
“Which is the best Rayner?”
“Buying high and selling higher or buying low and selling higher?”
Well…
All concepts have their pros and cons, but the key is knowing how to capitalize on the PROs and how to remedy the CONs.
This is exactly what I will teach you in the next section.
The Secret To Making Profits With Breakout Trading
Before I share some advanced tips with you on what to do next.
There’s one last thing to cover before moving forward.
Why breakout trading on the stock markets?
The primary reason is that it offers more opportunities.
Take the forex market’s 1-year heatmap for example…
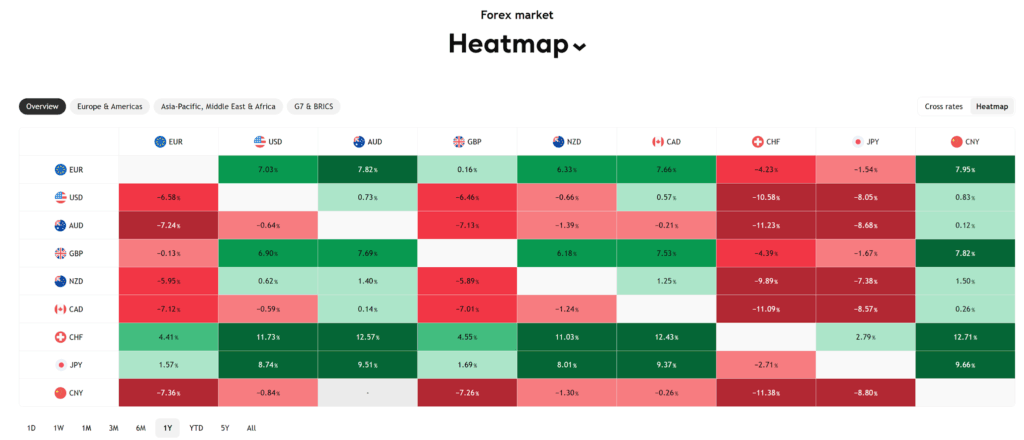
Can you see how the performance is inconsistent?
You’d have to pinpoint which pairs have been performing well to find trades for breakout trading.
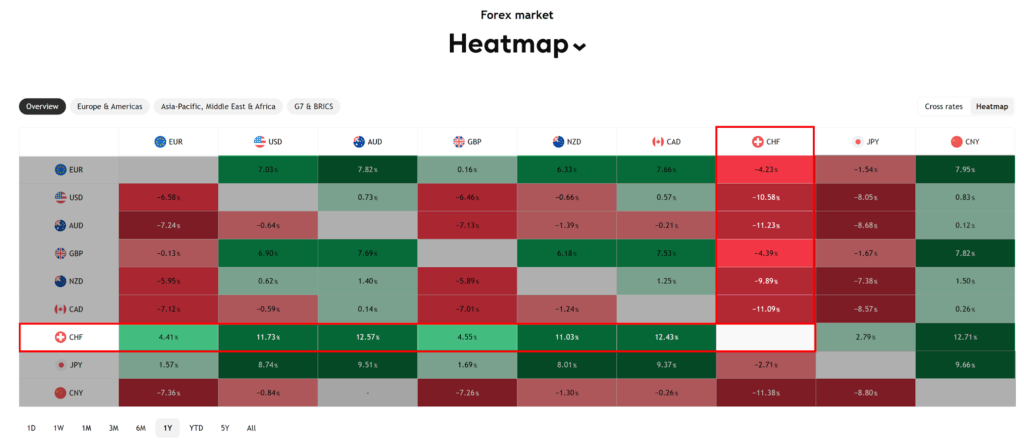
And even when you do, the opportunities are limited, for example, by focusing on the CHF pairs for longs and JPY pairs for shorts…
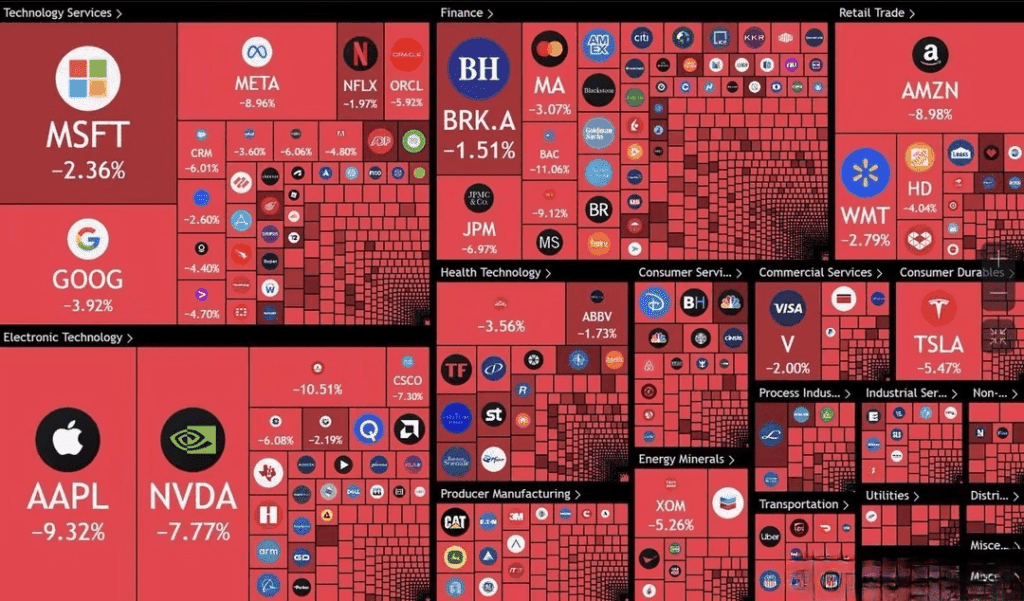
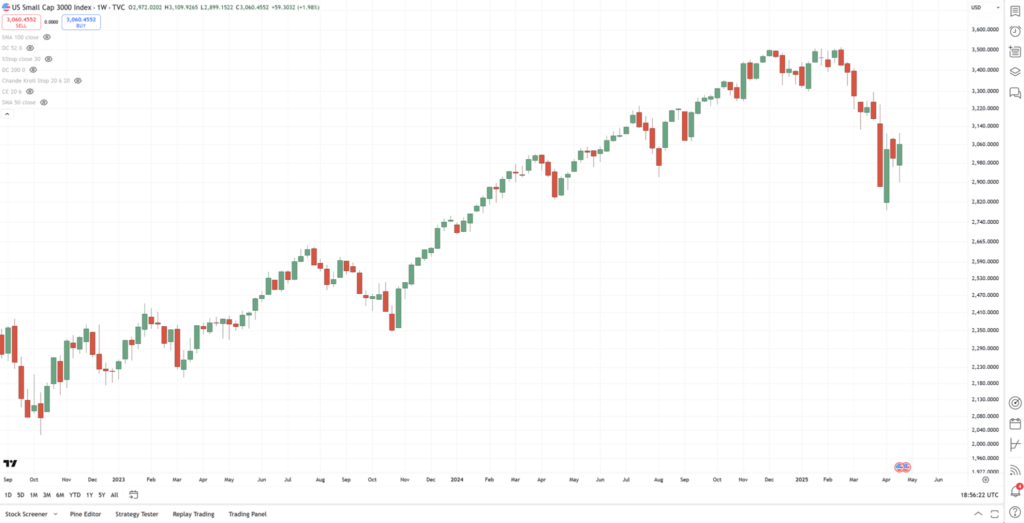
But what about the 1-year heatmap of US stock markets such as the Russell 3000?…
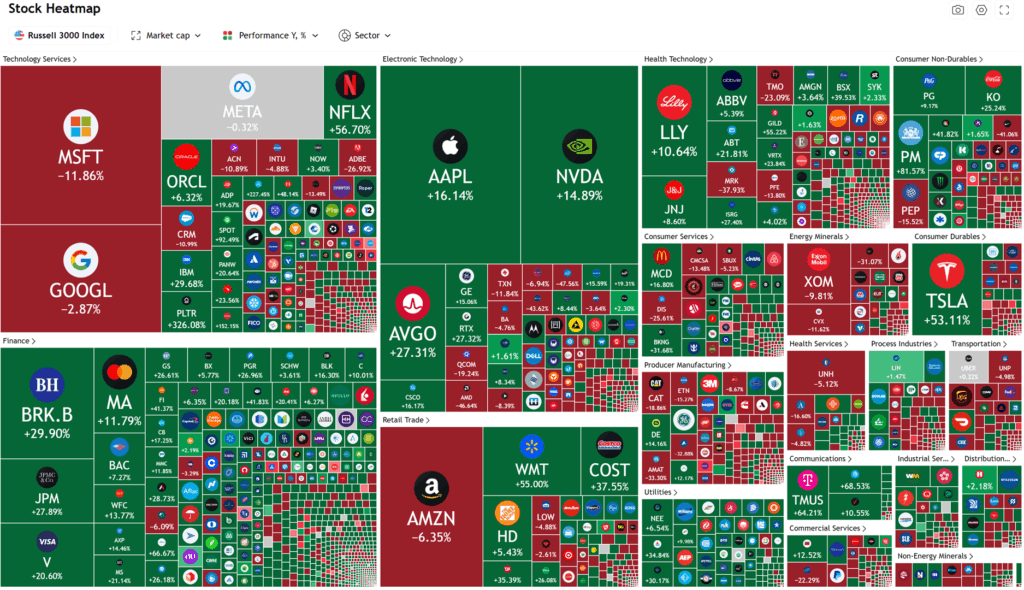
Woah… That’s a lot of stocks!
But this time, you can more easily spot which stocks are doing well and which aren’t.
Can you see AAPL and NVDA bulging out of the heatmap without squinting your eyes?
You get the point.
This is how trading the stock market complements the strengths of breakout trading.
More opportunities, better trends, and potentially bigger profits.
So now the next question is:
How exactly do you take advantage of this massive market?
Well, the three advanced tips I’ve been waiting to share with you are:
- Align with the broader market
- Use a trailing stop loss
- Apply risk management and position sizing
Let me explain…
Advanced Tip #1: Align With The Broader Market
Let’s face it.
It’s all sunshine and rainbows when the market pulls off a nice performance…
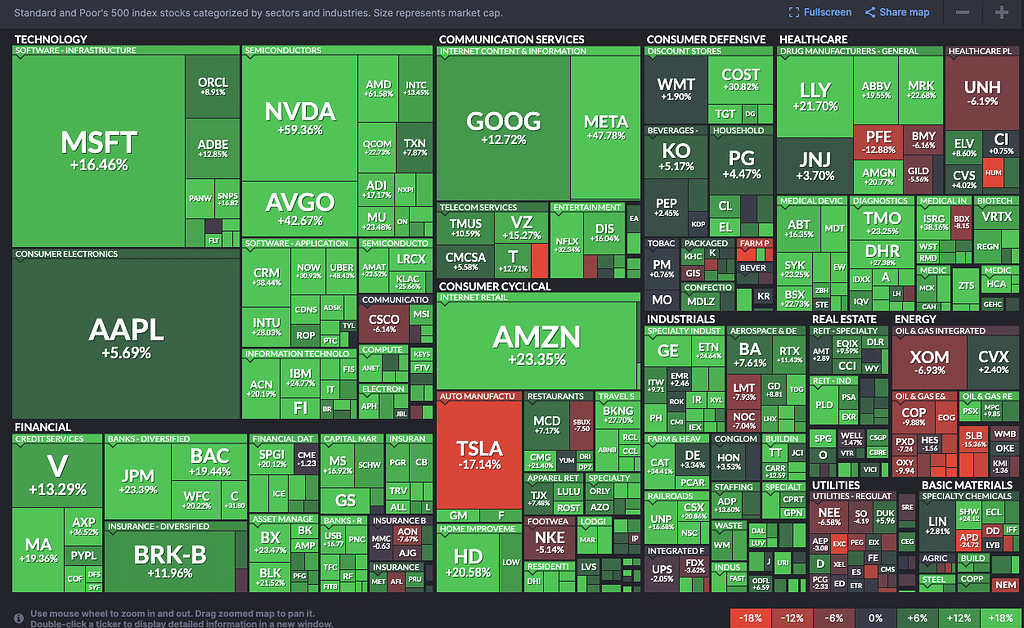
As you can see, it’s like an ocean out there – almost all stock on the heatmap is in the green!
But at the same time, when there’s fear in the market, there’s a lot of blood in the water…
Now, both heatmaps I recently shared with you are cherry-picked to show extremes.
But it’s to highlight how trends are a common behavior in the stock markets.
So, what should you do?
Simple, stay on the right side of the market!
When there’s a bull market => Go long
When there’s a bear market => Stay cash
Makes sense, right?
But you may ask:
When exactly should you go long and stay cash?
What’s the on/off switch here that you can use as a reference?
In this case, you can use a long-proven and tested concept…
An index filter
Instead of sifting through hundreds of financial reports and articles just to know whether or not you should stay cash, adopt an index filter.
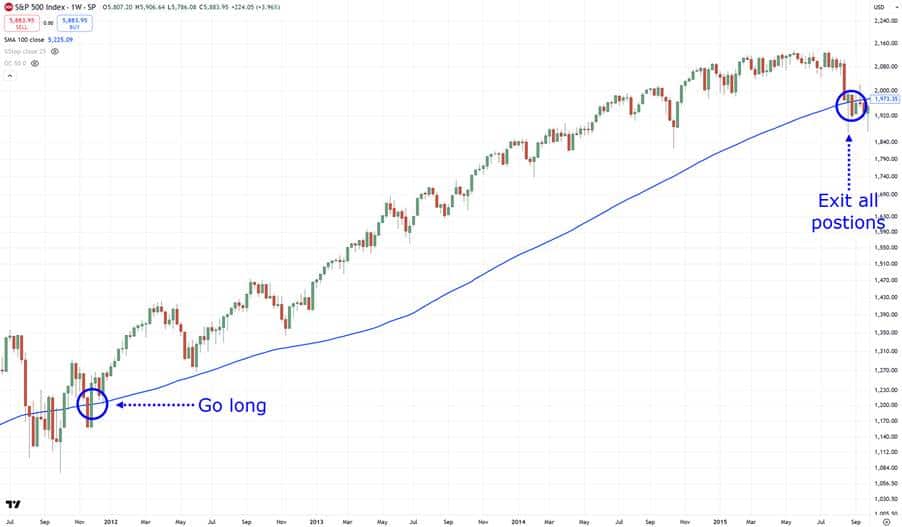
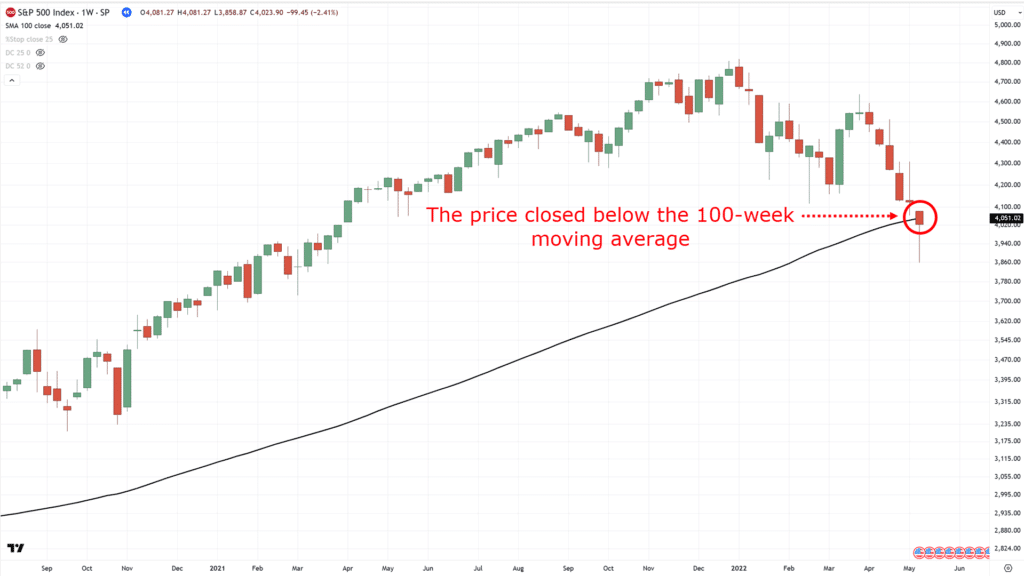
For example, if trading the S&P 500 index, pull a 100-week moving average on your chart.
If the price closes above the 100-week moving average, you start looking for trading opportunities…
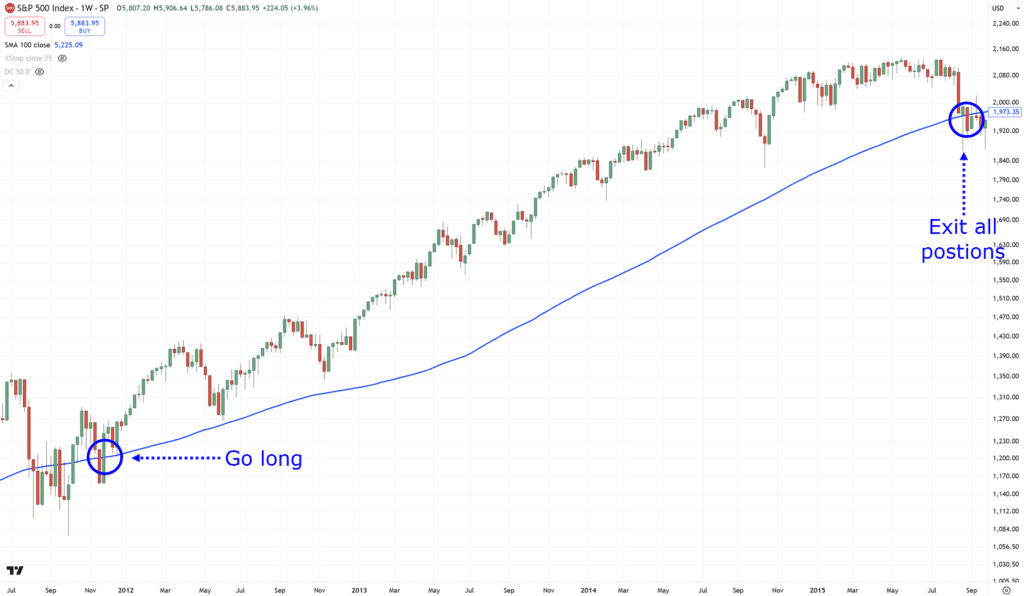
If the price closes below it?
You exit every single stock you own and stay in cash…
Sure, the signals can be mixed at times.
But this provides you with a systematic way of knowing when to be on the right side of the tide.
This improves your results and also reduces your losses.
Don’t believe me?
Then let me do a statistical test for you.
Here’s a performance of a stock trend-following system that trades in the S&P 500 without using an index filter…
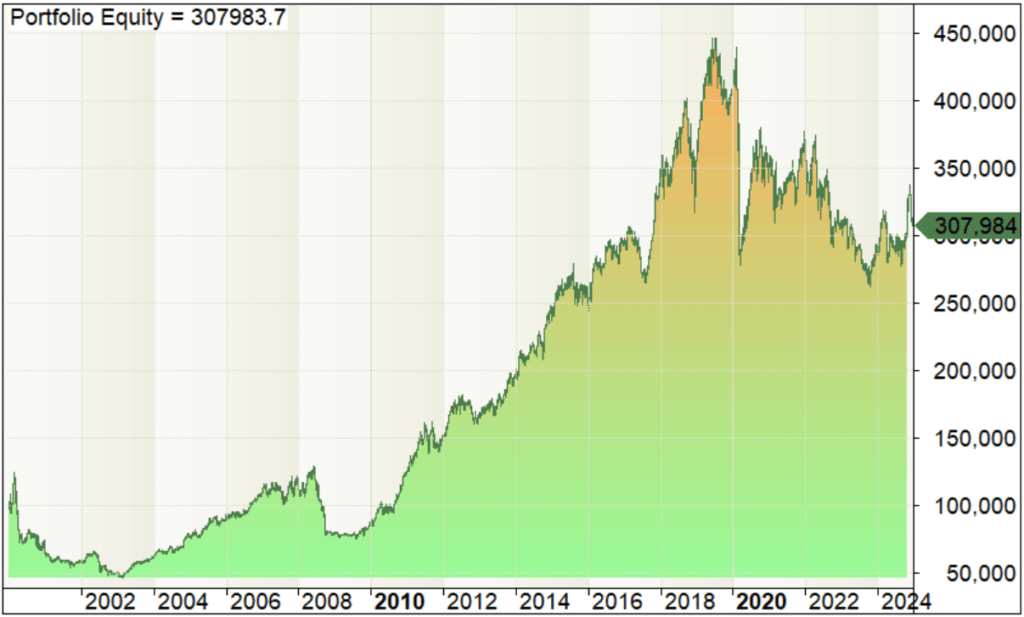
Sure, it makes money in the markets, but the results?
Not so good!
But how does it compare now when you put an index filter on it with the same rules and all?…
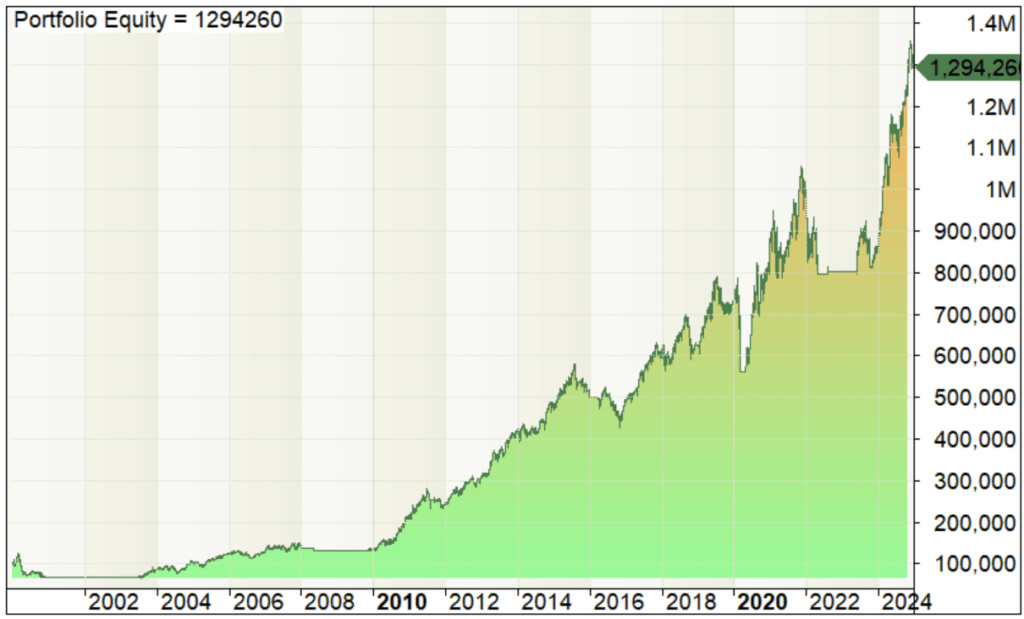
Boom, massive difference.
And all it took was just adding a single index-filter rule!
So, now that you know when to and when not to trade.
How do you know when to exit your trade?
Let me share it with you next…
Advanced Tip #2: Use A Trailing Stop Loss
By now, you understand that the goal is to buy high with the tide and sell higher as that tide ends.
Sure, there will be times where breakouts can be short-lived as you make a bit of a profit, and then the market reverses against you…
But at the same time, monster moves such as this can happen, where it seems like the sky is the limit…
Overall, when it comes to breakout trading, what matters is that you never know how high the stock can go.
There are many different ways to trail your stop loss, such as with indicators like the moving average, Donchian channel, or average true range…
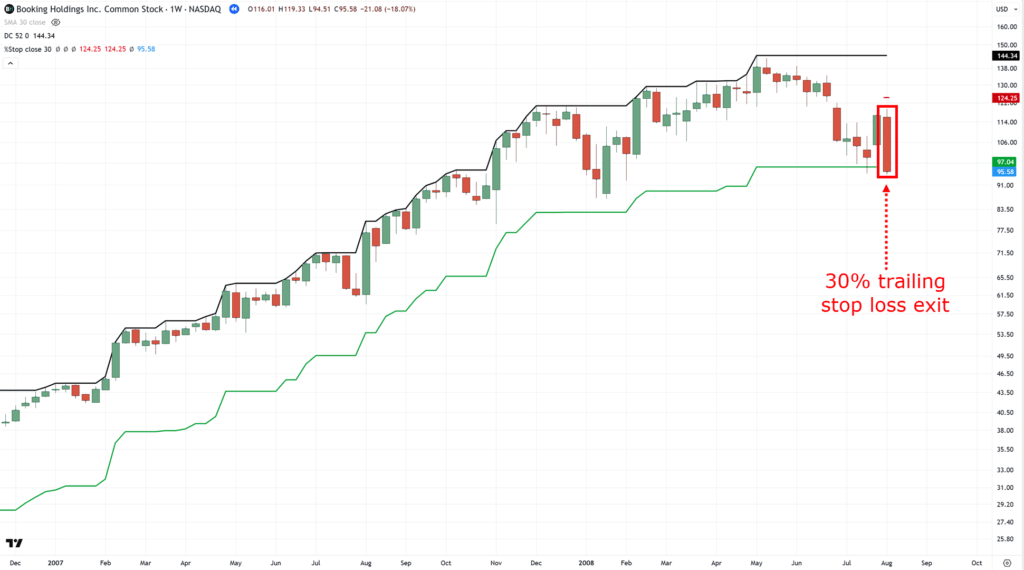
However, I’ll share with you a trailing stop so simple that it actually works – a percentage-based trailing stop loss!…
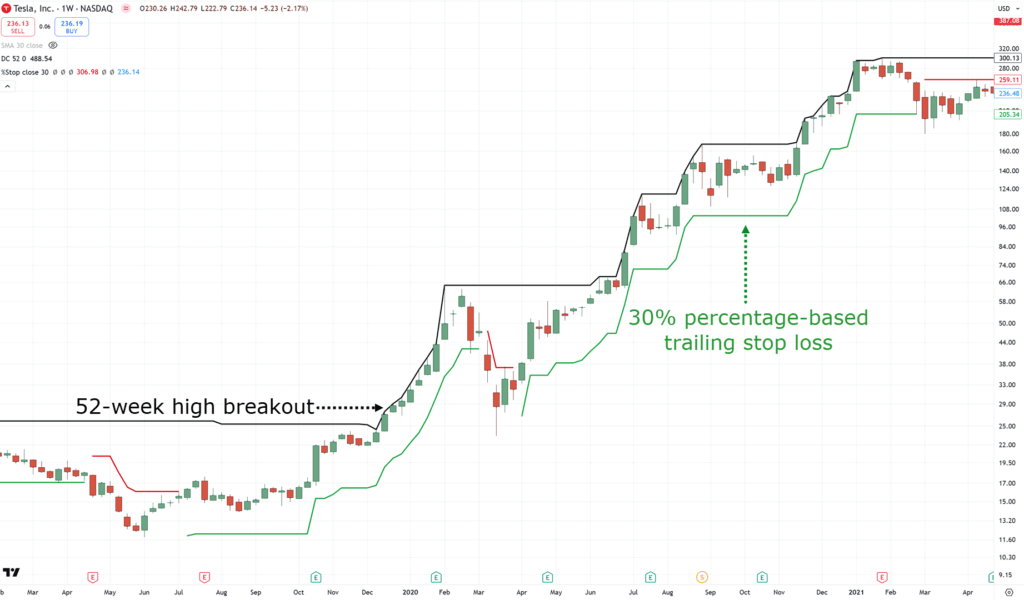
Using this method means that you’ll hold the stock until it declines 30% from its peak, for example…
It’s so darn simple, right?
There’s no need to memorize fancy formulas, just basic math!
Now, if you want to capture short-term trends, then you can adopt a 10% to 20% percentage-based trailing stop loss.
But if you go by the principle of trying to ride “big” long-term trends, then you’d want to consider using 30% or higher.
Got it?
Now, I know it’s easy to cherry-pick these sexy stocks that went to the moon.
But as you know…
That’s not how reality goes, right?
Oftentimes, the market either reverses against you the moment you hit that buy button, or smells your take profit level and then crashes back down to the ground!
So, how do you remedy this?
How do you “increase” your luck in breakout trading in the stock markets?
Let me share the next and final advanced tip in this section with you.
Advanced Tip #3: Apply Risk Management and Position Sizing
You can never eliminate the fact that at some point, the stock that you have entered will go against you.
…or you get a breakout setup that suddenly fails.
But at this point, you should consider them “business costs.”
The good news is that you can reduce those costs through variety:
Diversification through portfolio allocation
Now this is just a fancy way of holding multiple stocks at the same time.
So, if you have a $5,000 account, for example, and you have a 10% portfolio allocation rule…
This means that you won’t buy a stock worth more than $500.
And yes, you guessed it: This gives you a maximum open trade of 10…
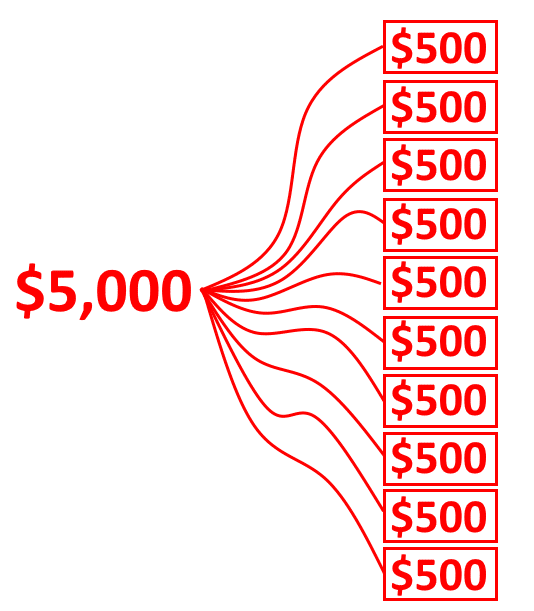
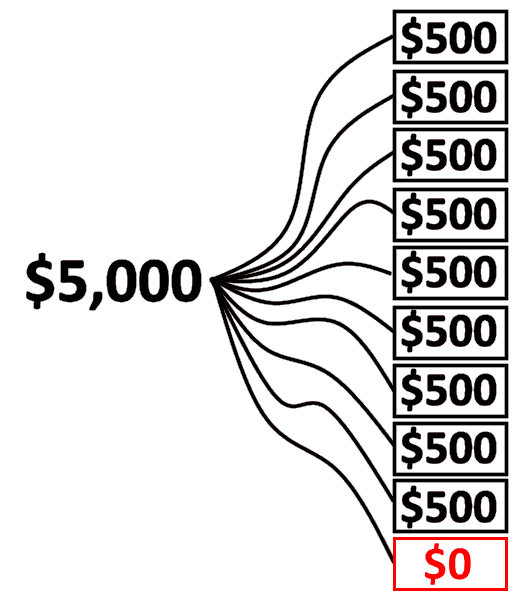
The reason why you should do this is that you can never know precisely which stock will do well or badly.
By adopting a portfolio allocation, even if one of your stocks goes to zero, you’d still have enough funds to push on trading…
On the other hand…
By holding multiple stocks in your portfolio, you have a good chance of catching long-term breakouts in the market.
Even if it’s just one or two stocks, it may just be enough to push your portfolio back to the green or more.
So, now that you know the ins and outs, as well as “why” behind breakout trading.
You might as well call yourself the master of breakout trading!
But to consolidate everything you’ve learned so far, I’m going to share with you a proven and backtested breakout trading system that works.
You ready?
Then let’s get started!
A Breakout Trading System That Works
Here is what makes this guide extra special.
A complete breakout trading strategy with its full backtesting results, to show you how it has performed in the stock market.
Of course, past results are never indicative of future results.
But let me ask you:
Would you trade a system if it performed poorly in the past?
No way, right?
And that’s what I want you to understand here.
This breakout strategy has generated 5,175.77% over the last 30 years.
To begin, though, here are a couple of important details about this breakout trading system you need to know:
- This system trades off the weekly timeframe only
- This system has been tested to trade on the S&P 500 while using the index itself as a trend filter
- This system uses a 10% portfolio allocation, which gives you a maximum of 10 stocks in your portfolio (remember what I taught you earlier?)
Now, let’s go through the rules of this system together.
The S&P 500 is above the 100-week moving average
Remember this concept I taught you a while back?
This is the very same backbone of this system.
But as a refresher, all you have to do is pull out a 100-period simple moving average and go to the weekly timeframe…
As long as the price is above it, you hold your trades or keep on opening trades according to the rules.
Basic stuff, right?
So, what’s the next thing to look for?
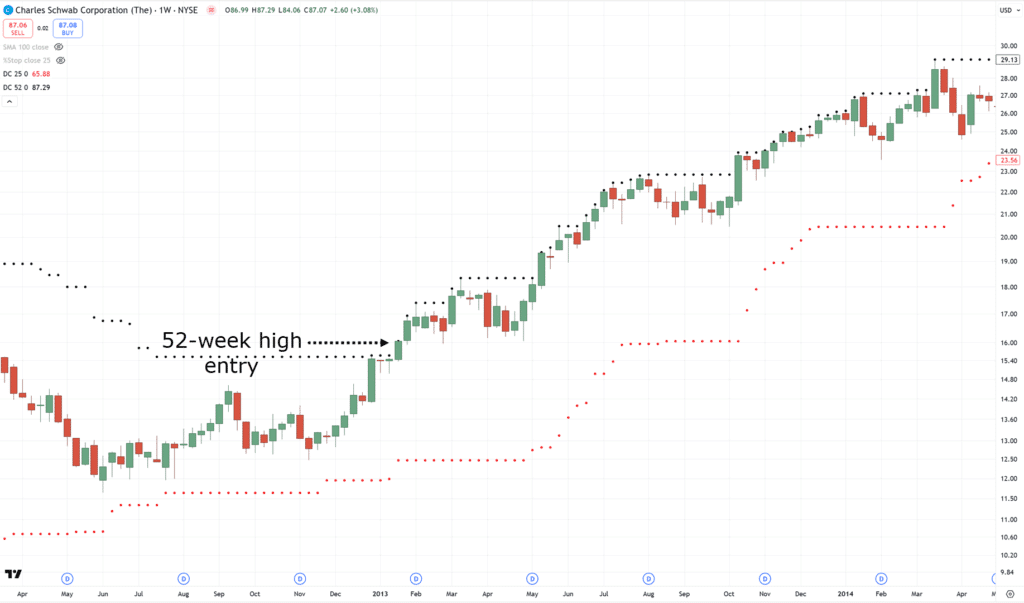
If the stock makes a new 52-week high, then buy the stock at the next week’s open.
The rule is pretty much self-explanatory, right?
However, the struggle here is finding all-time highs consistently.
There are about 500 stocks in the index we’re trading at.
It would be madness to look over all of those stocks manually every weekend!
So, what’s the solution?
You guessed it, a stock screener.
Thankfully, the rule is simple enough that you can use a couple of free screeners and make this work.
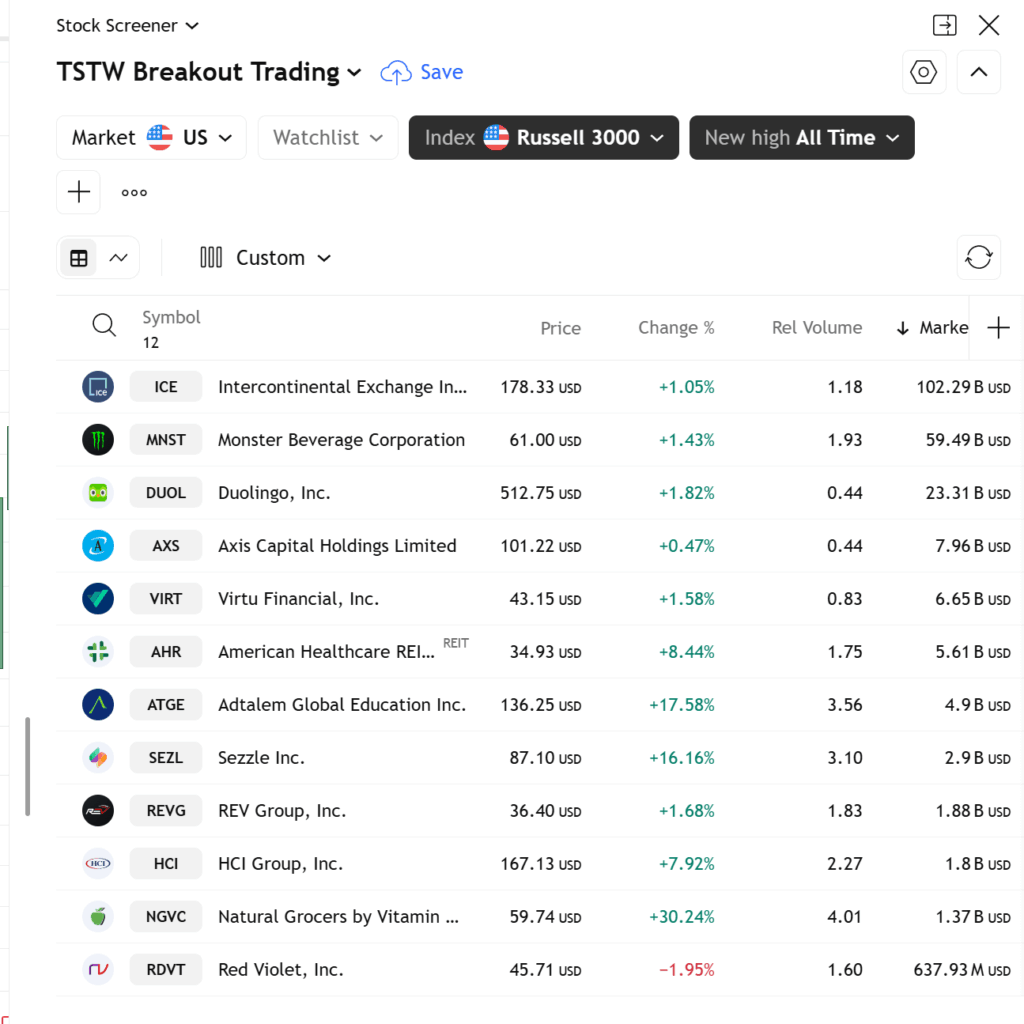
One such screener is through TradingView!
Now, if you go to TradingView’s charts, we’d probably see the same thing here…
But what you want to focus on is this button here…
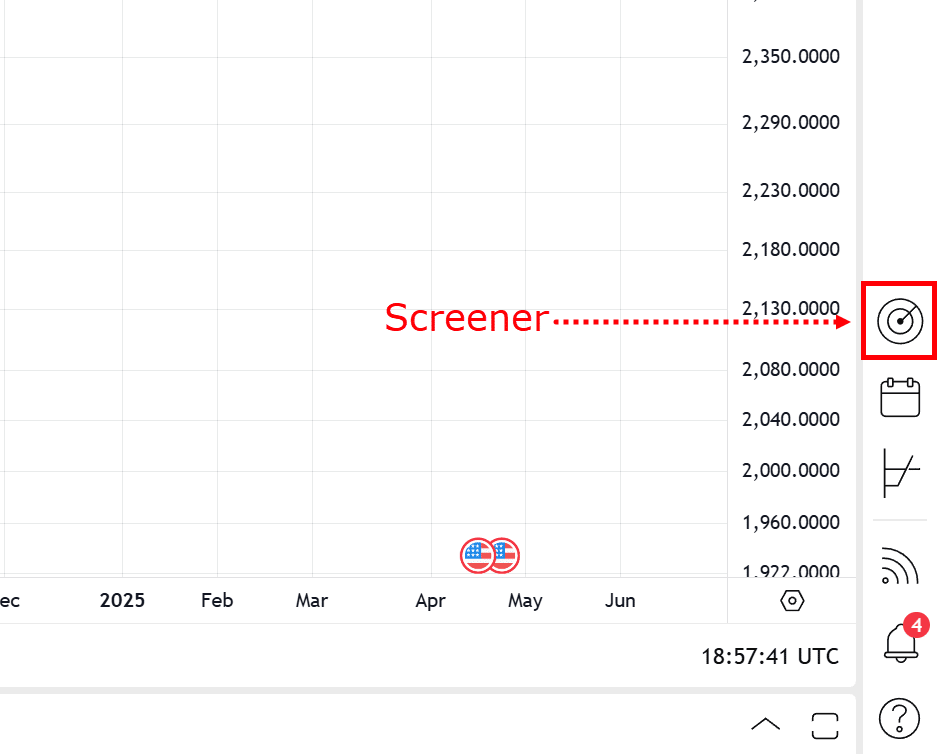
And now it should show something like this…

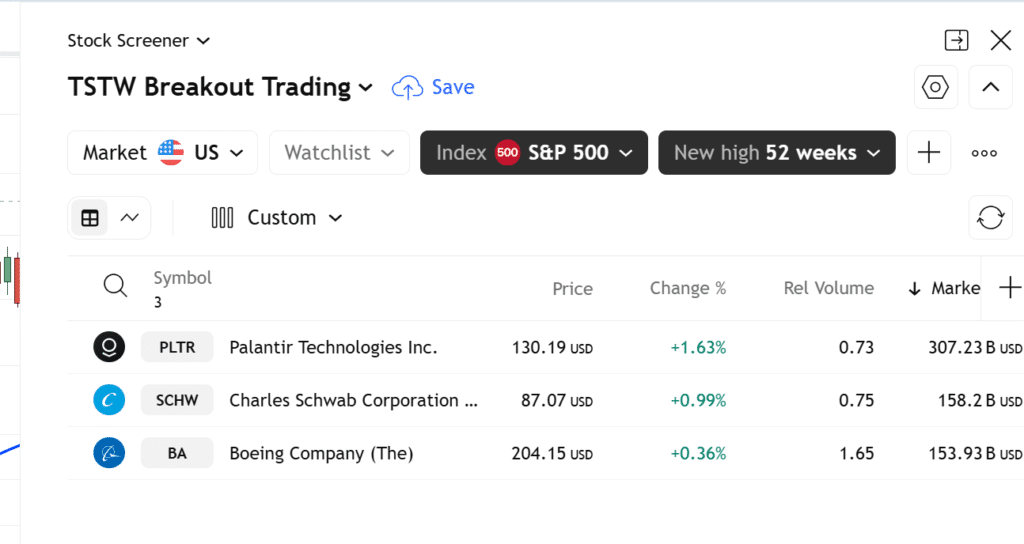
Recall, we’re trading the S&P 500, and we’re looking for all-time highs here.
So, all that matters is setting your index to S&P 500…
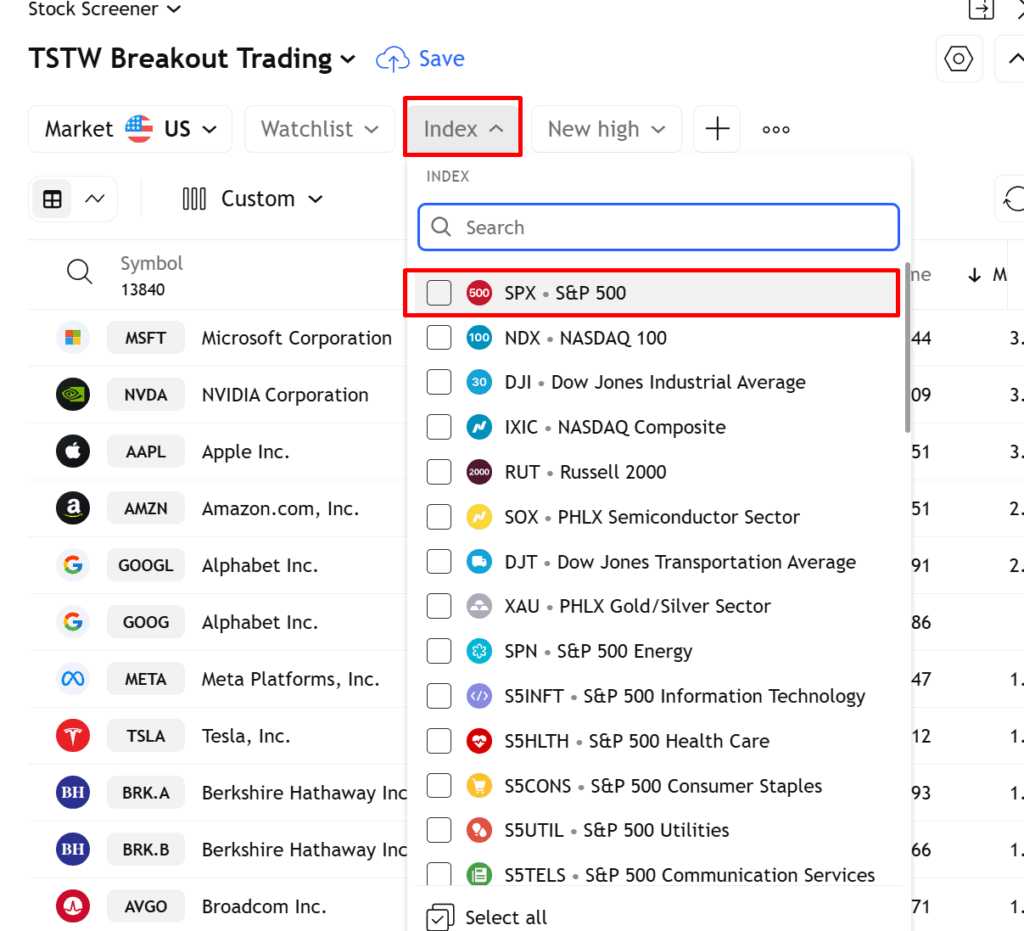
…and making sure that you enable the “new high” filter and set it to 52 weeks…
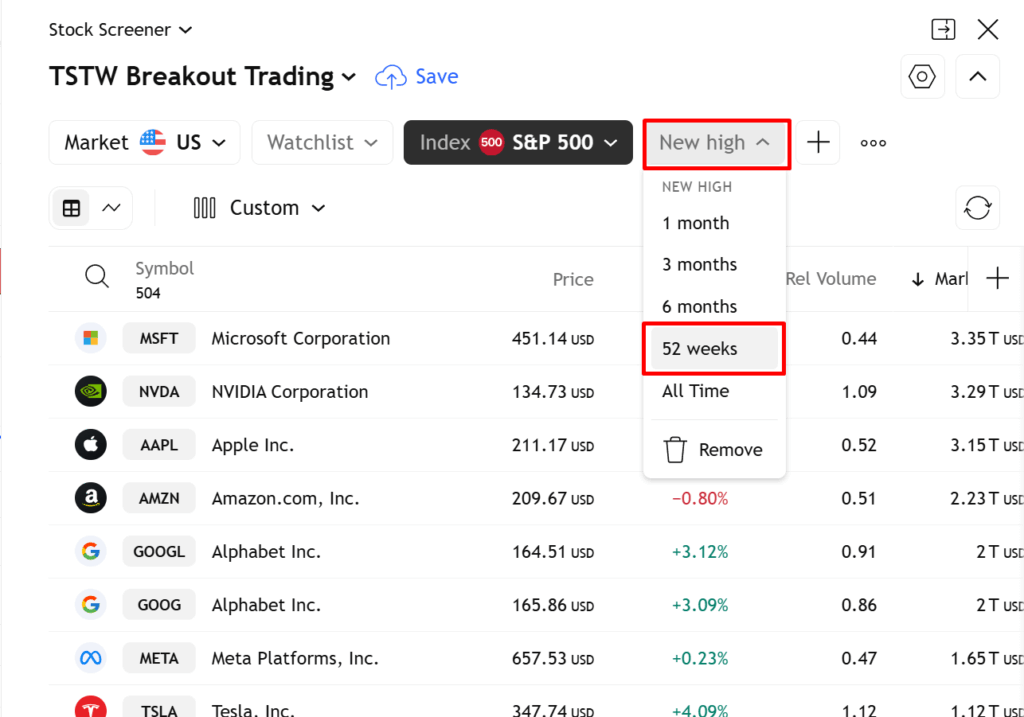
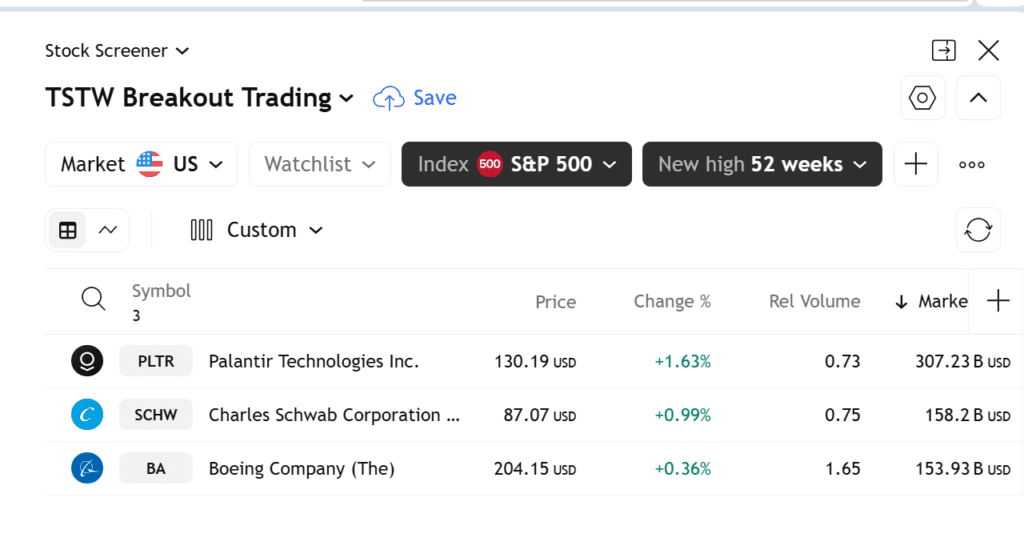
As of scanning today, here are the stocks that came up on my list…
Remember, you only do this scan once a week, every weekend, preferably when the previous week’s market is closed.
So, with these stocks on the list, what’s next?
Rank stocks based on the 80-week rate of change, and prioritize trading stocks at the top of the ranking
This step might seem new, but we’re incorporating a ranking tool called the Rate of Change (ROC).
The rate of change indicator looks something like this…
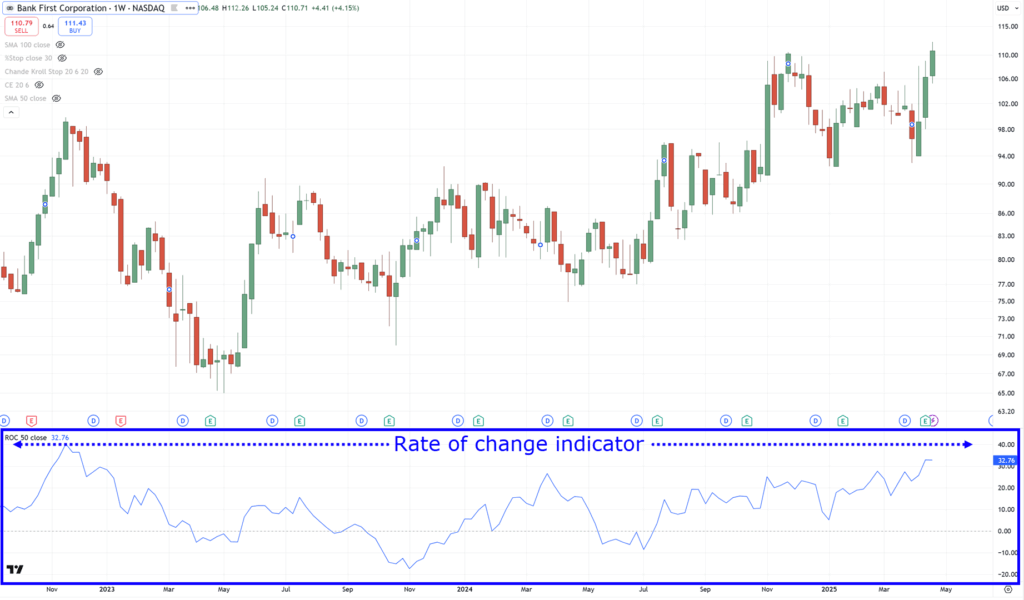
What it does is simply measure the strength of the stock.
It doesn’t show oversold or overbought conditions. Simply put, the higher the ROC value, the stronger the stock, which is just what we’re looking for!
So, based on the stocks that have made their 52-week high closes based on the screener I shared with you a while ago…
You now individually look at those stocks on the list and get their 80-week rate of change values.
Here are their values…
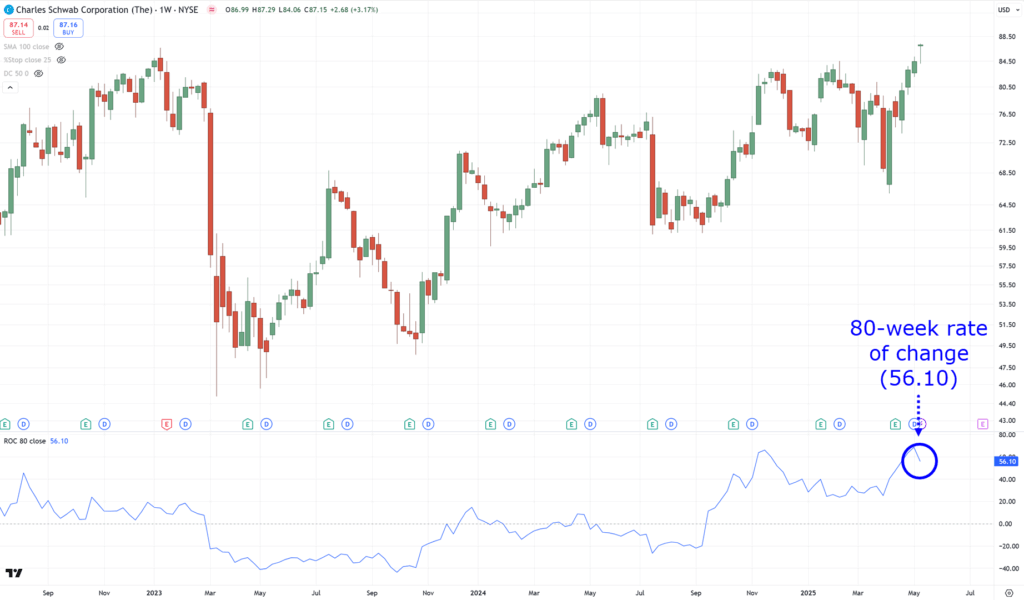
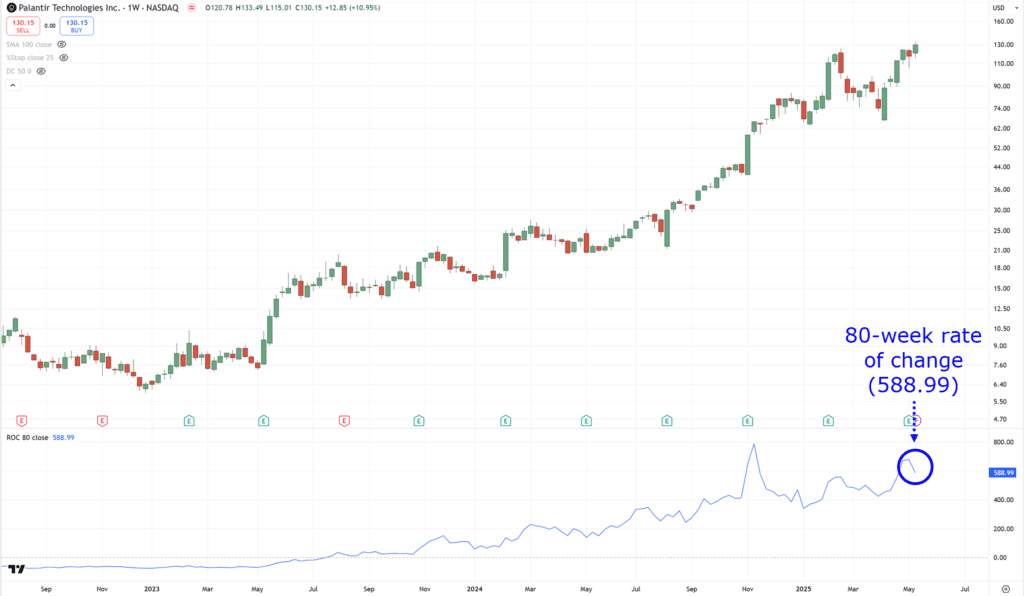
So, based on the ROC rankings, you’d want to enter a trade with PLTR first, then SCHW, then finally BA.
Fortunately, there aren’t a lot of stocks on the list.
However…
There will be times when your scans might look like this…
And you might be wondering…
“Wow, should I enter all of those stocks?”
Nope!
Remember, you have 10 max open trades.
The rule is to only allocate a maximum of 10% of your portfolio per stock!
And this is why you rank stocks based on ROC, so that you know which ones to trade first.
So, now that you’ve entered the stock.
How should you manage it, or exit it?
If the stock closes below the 25-week low, then sell the stock at next week’s open.
For this rule, you can simply use the Donchian Channel, where the lower channel is the only one being shown…
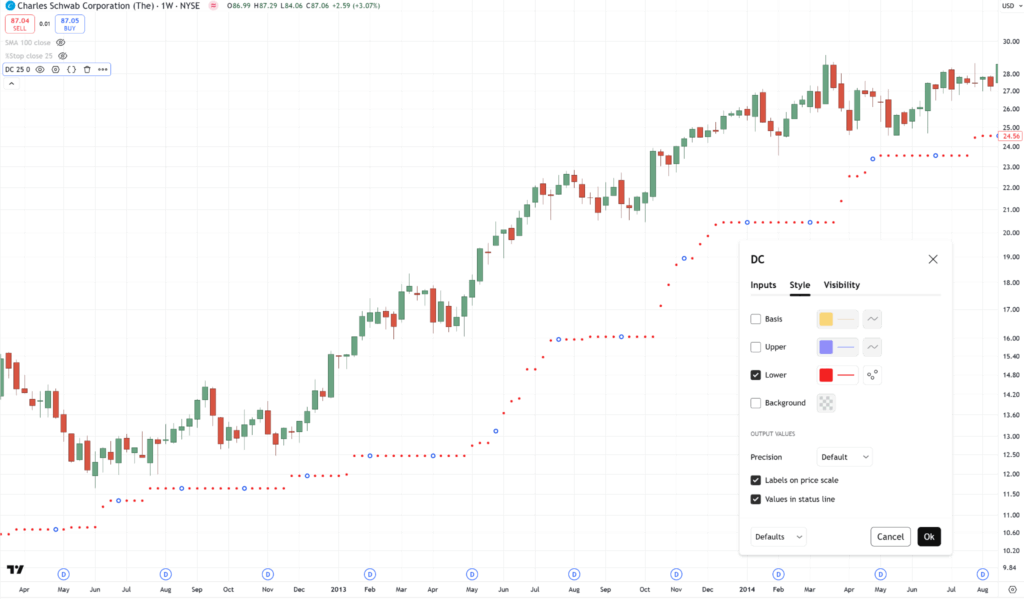
And at the same time, the period is set to 25…
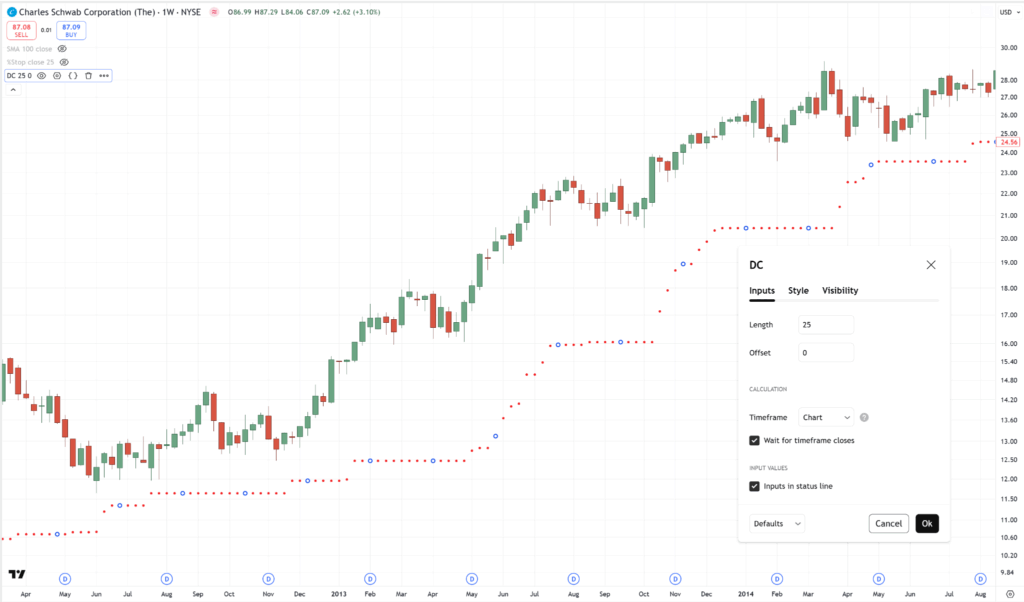
Again, we’re trading the weekly timeframe – make sure your chart is set to it.
So now, for example, you’re in a trade and a stock has gone way in your favor…
You’d only want to exit this trade if the stock closes below its 25-week low…
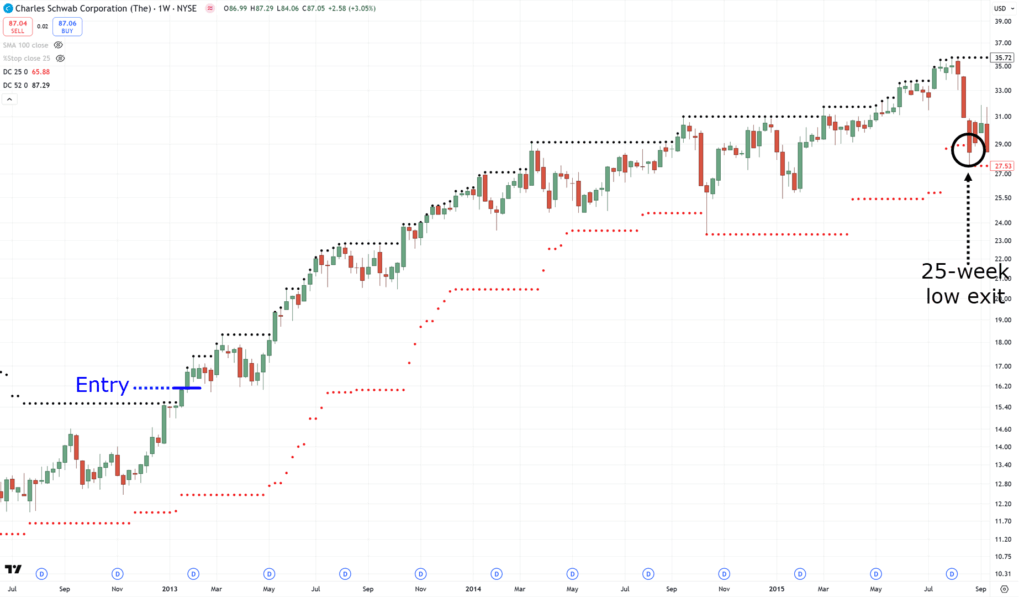
Pretty straightforward, right?
How about exits, though?
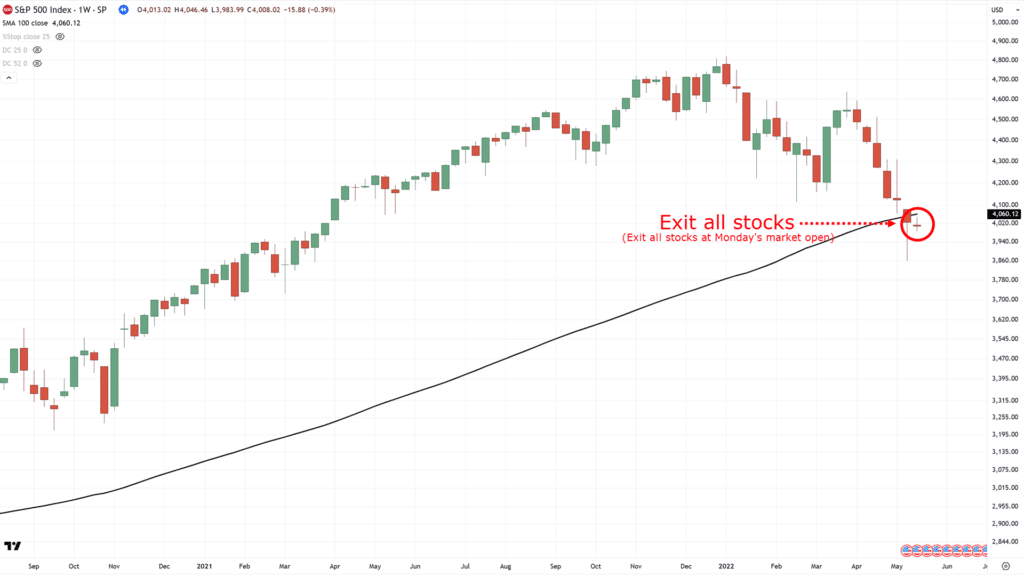
If the S&P 500 is below the 100-week moving average (based on weekly close), then exit all positions at next week’s open.
When things are great, keep holding on to your trades.
But what should you do when it crosses below the 100-week moving average?
Easy, if the price closes below the moving average on Friday, for example…
Then on Monday, the moment the market opens, you exit all positions and stay in cash…
Got it?
So now that you know the rules, does this system really work in the stock markets?
How much does it make per year?
Well, stay tuned as I’m about to show you what an “edge” looks like in the markets.
Breakout Trading System Results
As you know, this is an objective trading system with clearly defined rules.
This means you can backtest this trading system and see how it fares.
The backtest duration is from 1995 to 2024.
That’s a lot of data!
However, it has gone through a couple of crises such as the 1997 Aian financial crisis, the 2008 financial crisis, the 2020 Covid crisis, and even the Russia-Ukraine war.
This system has survived them all and is still making profits.
So, here are the results…
- Number of trades: 320
- Average Annual return:13%
- Maximum drawdown: –12%
- Winning rate:50%
- Payoff ratio:38

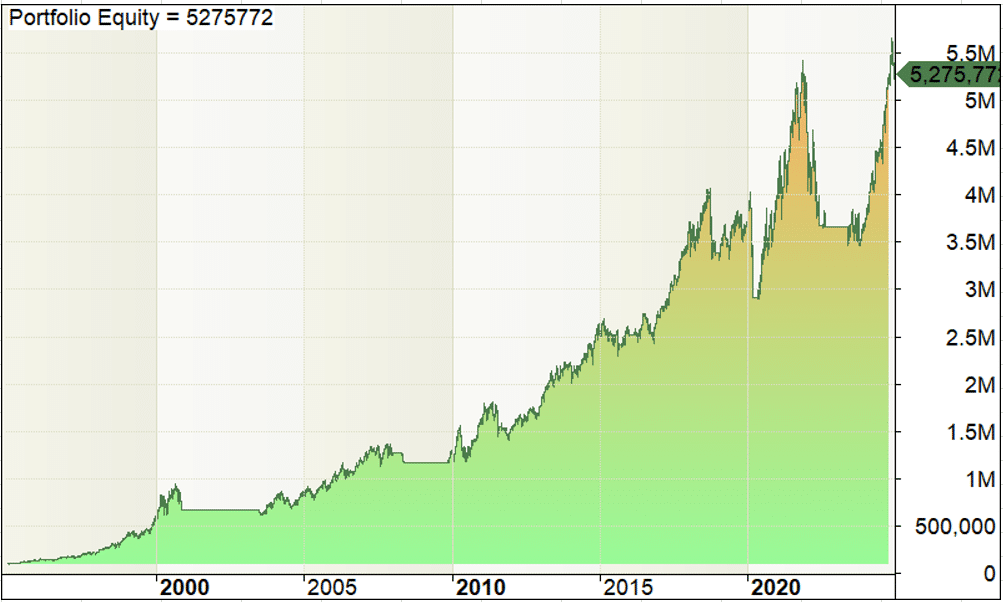
As you can see, the breakout trading system has had five losing years over the last 30 years.
Still pretty impressive, right?
Now, while this system makes an average of 14.13% a year, those numbers are not guaranteed.
Sometimes, you’ll make big gains like in 2024.
But sometimes, a year may end up as painful as 2022.
So, just to add how the system performs during bad times, here’s an underwater equity curve as a bonus:
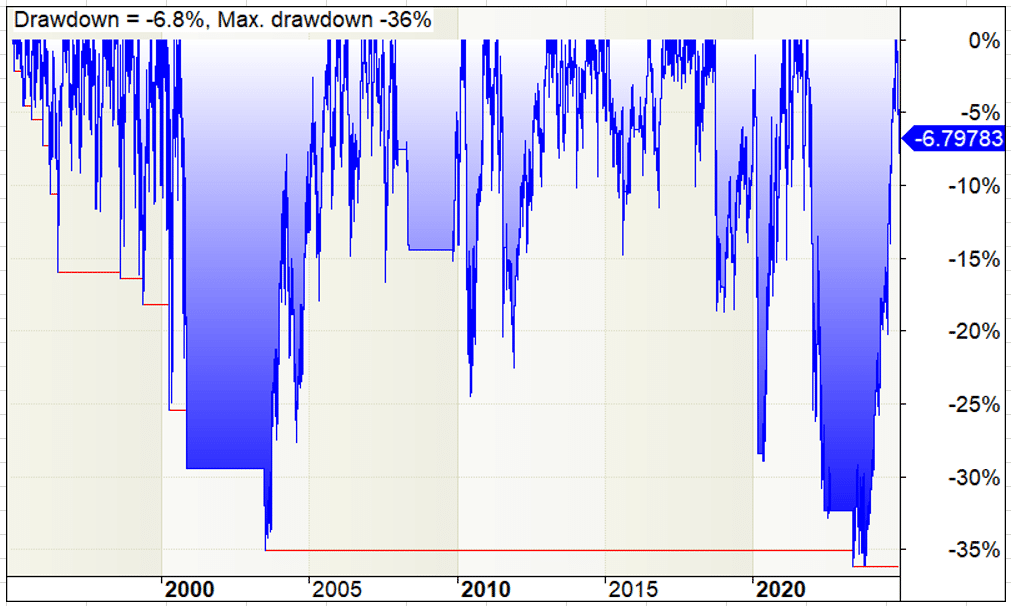
It shows how often the system goes into a losing streak, and how steep they are.
So be prepared!
And there you go – a complete breakout trading system that has a quantifiable edge in the markets!
But of course…
Learning a strategy is one thing, but executing it consistently is the hard part.
As losses pass, you’ll start asking the deeper questions…
“Why this indicator?”
“I wonder if I should modify the settings?”
“Why not use this concept?”
And this is why I created an FAQ…
Frequently Asked Questions
Finally, here are some commonly asked questions about breakout trading.
What type of order do I use to enter the trade?
In this case, you’d want to enter with a market order.
If the 25-week low is hit during the week (between Tuesday and Friday), do I exit the trade immediately or wait for the weekly candle to close?
You wait for the weekly candle to close.
Once the weekly candle closes, and on Saturday, if the closing price is above the 25-week low, you hold the trade.
If it’s below it, then you exit the trade on Monday.
If the S&P 500 moves back above the 100-week moving average during the week, do I buy stocks that meet my criteria immediately or wait for the weekly candle to close?
In this case, you wait for the weekly candle to close.
If the S&P 500 closing price is above the 100-week moving average, then you buy stocks according to the trading rules.
If not, remain in cash.
Why do you use the S&P 500 instead of the Russell 3000?
There’s no particular reason.
You can use the Russell 3000, and the trading system will still work!
When it comes to the 100-week moving average, do I use a simple or exponential moving average?
While I use a simple moving average, it doesn’t matter which you use.
The concept behind it is what matters, not the parameters.
I’d be worried if a trading system broke down due to a minor parameter change, as this would tell you it’s likely curve-fitted.
Does the breakout trading system work for short selling using an opposite set of trading rules, meaning you short stocks at an all-time low?
I’ve backtested this, and unfortunately, it doesn’t work.
You’ve now taken a deep dive into the mechanics and inner workings of this breakout trading system, learning how it has survived and profited over decades.
That’s right… Decades!
Now, here’s one last secret that I want to tell you:
This is just one of my working systems.
What’s been discussed here is breakout trading, but I also have trend-following systems and mean-reversion systems – each with their own edges in the markets.
Imagine if you could trade multiple (uncorrelated) trading systems that work…
…it’d be like having multiple streams of long-term income, right?
So, if you want to learn more about them, a new book is being released called Trading Systems That Work.
In this book, you’ll get the full package – the system I shared with you today, but much more improved, along with three other systems.
You’re welcome to check it out here.
With that said… I want to know what you think!
Do you think that systems trading is the “easiest” way to find an edge in the market?
If so, do you plan to develop your system someday?
Or try to trade one that already works and then work from there?
Let me know your thoughts in the comments below!