Solana Price Shows Signs of Weakness Amid Declining Stablecoin Supply
The Solana (SOL) price has been experiencing a decline, down 21% from its monthly high, according to data from crypto.news. This drop is attributed to the decreasing stablecoin supply on the Solana network, which has fallen by 5.5% to $15.01 billion in the last 7 days. Stablecoins play a crucial role in providing liquidity and serving as the primary capital base for on-chain trading, and their decline indicates weakening investor demand and lower capital inflows.
Technical Indicators Point to a Bearish Trend
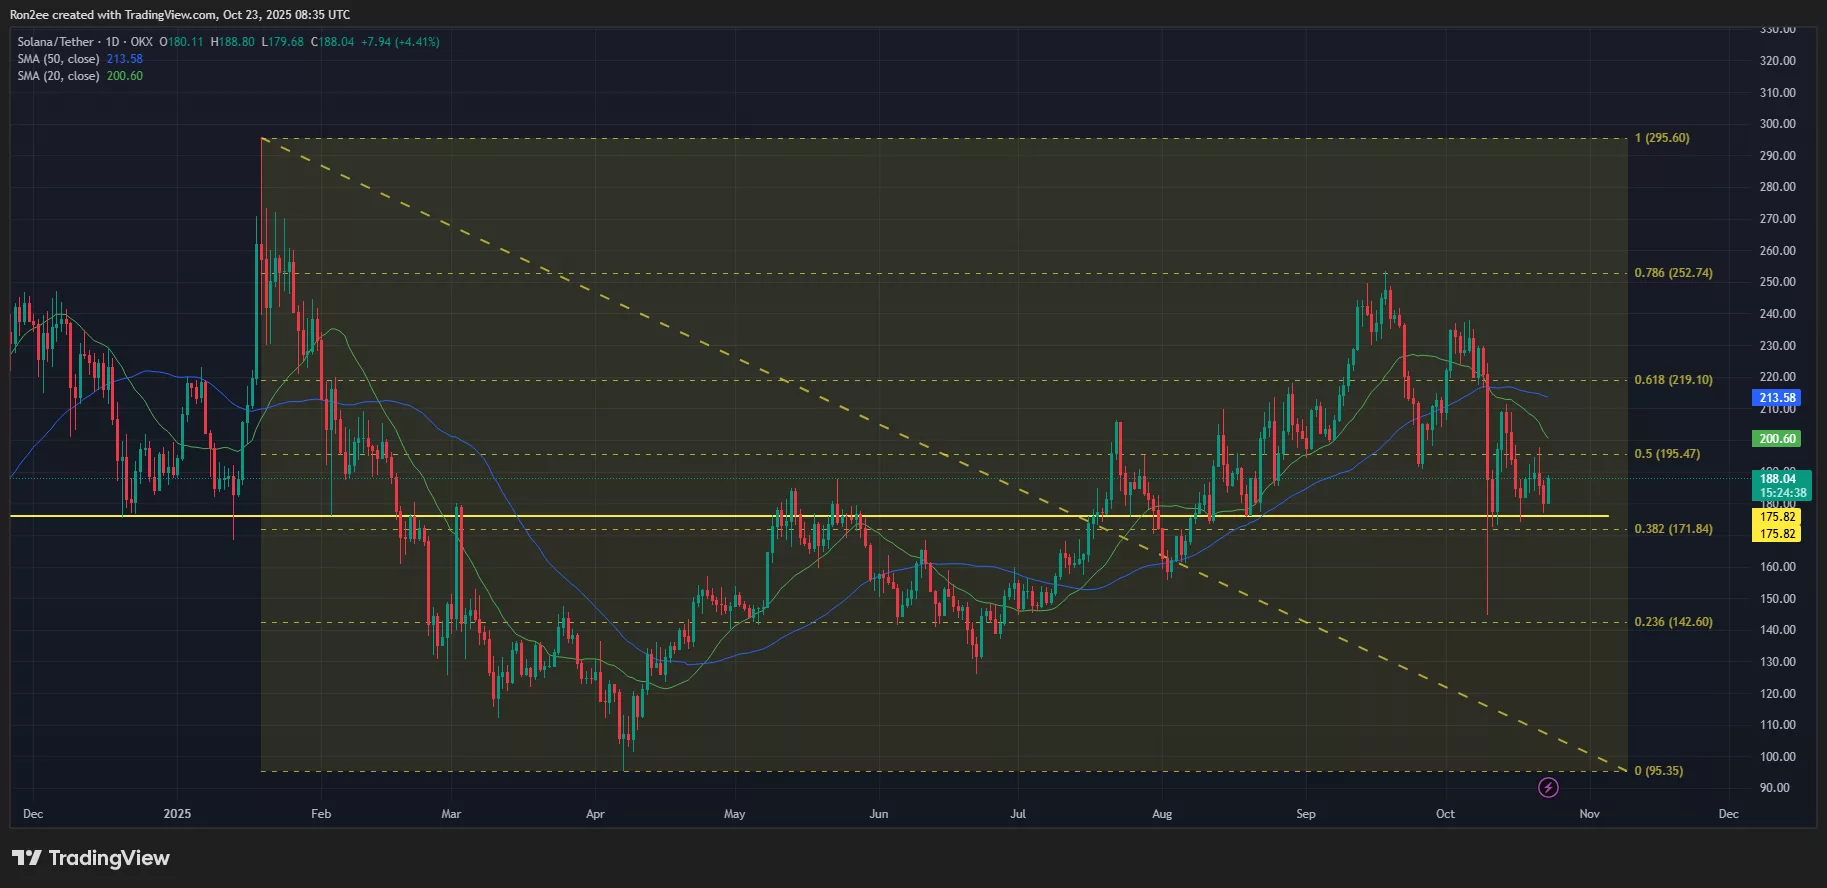
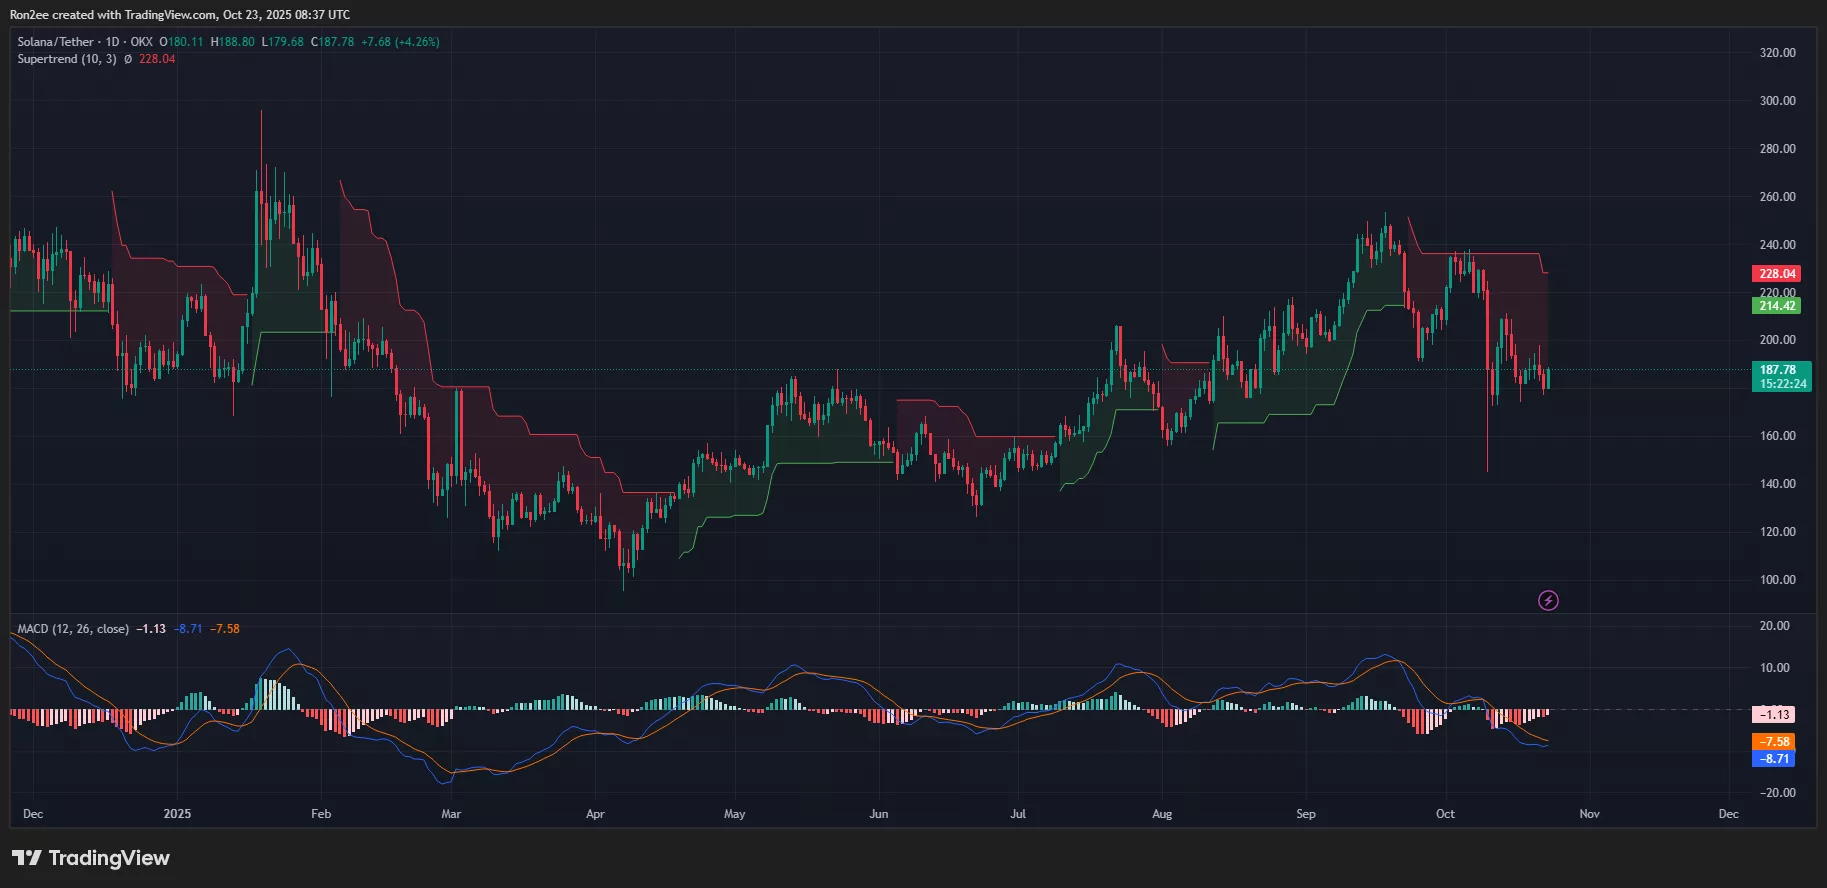
Technical indicators on the 1-day chart are largely bearish, with a bearish crossover forming on the daily chart. The 20-day simple moving average has crossed below the 50-day moving average, suggesting weakening momentum and a possible continuation of the downtrend. Additionally, the supertrend is flashing red, and the MACD lines are pointing downwards, both signs of ongoing selling pressure.
 SOL price has formed a bearish crossover on the daily chart – October 23 | Source: crypto.news
Market Sentiment and Upcoming Events
The decline in Solana price comes amid renewed macroeconomic jitters due to escalating tariff tensions between the US and China and the ongoing government shutdown. Investors are waiting for clearer signals before re-entering the markets with confidence. The upcoming US CPI report, expected on October 24, will be a key data point that could influence the Federal Reserve’s next move and determine the Social Security cost of living adjustment in 2026.
If inflation turns out to be higher than expected, it could put new pressure on crypto assets like Solana. On the other hand, a cooler CPI reading could trigger a broader recovery rally in risk-on markets. Solana was trading below the 200-day EMA, a key dynamic level that is being closely watched by both traders and investors.
 Solana Supertrend and MACD Chart – Oct 23 | Source: crypto.news
Support Levels and Potential Correction
At press time, Solana price was approaching a very important support level at $175.82. The bulls have already defended this area several times. A break below could pave the way for a significant correction, potentially sending SOL into lower demand areas around $165 or even $150 if bearish momentum accelerates. On the contrary, if Solana bulls manage to rally to $200, it could trigger a trend reversal and open the door for a possible short-term recovery.
For more information on the Solana price and its potential impact on the crypto market, visit https://crypto.news/solana-sol-price-flashes-bearish-crossover-as-stablecoin-supply-shrinks/

