Spot Solana ETFs Attract Record Inflows Amid SOL Price Volatility
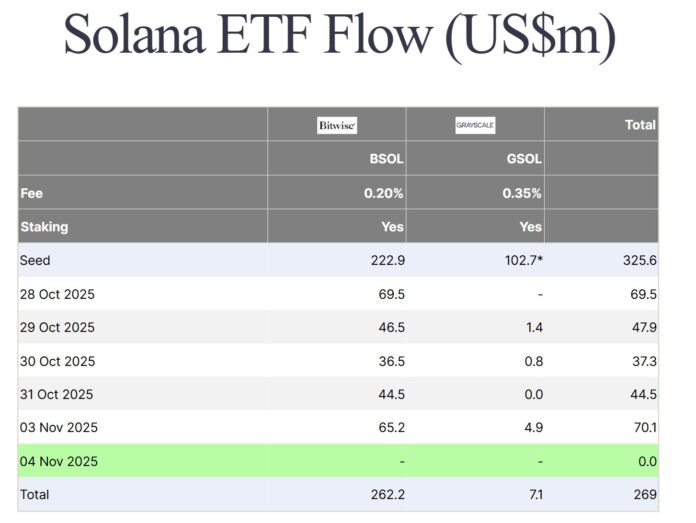
Spot Solana (SOL) Exchange Traded Funds (ETFs) have commenced their trading journey with remarkable strength, witnessing record positive inflows that underscore the growing institutional demand for the network’s native asset. The influx of investments into SOL ETFs has been unprecedented, with a daily high of $70 million in inflows recorded on Monday, marking the strongest inflow since their launch. This substantial investment brings the total spot ETF inflows since their October 28 debut to $269 million.
According to data from Farside.co.uk, the spot SOL ETF flow has been impressive, with total weekly net flows of SOL ETP exceeding $400 million, marking the second-highest weekly inflows on record. This significant investment is a testament to the growing interest in Solana’s native asset among institutional investors.
Solana ETF Performance and Price Action
The performance of Solana ETFs has been notable, with Bitwise’s BSOL US Equity and Grayscale’s GSOL US Equity seeing a total of $199.2 million in first-week net inflows, excluding seed capital. Bitwise’s BSOL ETF led the way, accumulating $401 million in assets under management (AUM) as of October 31, representing over 9% of total global SOL ETP AUM and 91% of global SOL ETP inflows last week. In contrast, Grayscale’s GSOL US Equity attracted just $2.18 million, representing about 1% of total ETP inflows. The total weekly net flows of SOL ETP can be seen in the graph: .
Despite the record inflows, SOL’s price action turned sharply downward this week, falling over 16% to hit $148.11 on Tuesday, its lowest level since July 9. The correction also broke a 211-day uptrend that began on April 7, with $95 serving as a yearly low. Solana is currently testing a daily order block between $170 and $156, an area of limited support, as seen in the Solana one-day chart.
The downturn pushed the price below the 50-day, 100-day, and 200-day EMAs, indicating a possible bearish confirmation on the daily chart. With liquidity currently testing lows around $155, SOL could initiate a mean reversion rally if buyers defend this area, especially as the Relative Strength Index (RSI) hits its lowest level since March 2025. However, acceptance below $160 and failure at $155 could reveal the next downside target between $120 and $100 and mark a deeper correction phase unless a short-term recovery occurs soon.
This article does not contain any investment advice or recommendations. Every investment and trading activity involves risks, and readers should conduct their own research when making their decision. For more information, visit https://cointelegraph.com/news/solana-etfs-show-strength-but-sol-price-lost-its-yearly-uptrend-is-dollar120-next

