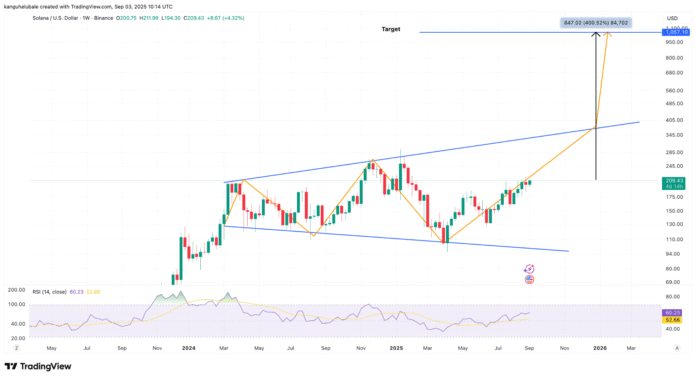
Solana (SOL) has been making waves in the cryptocurrency market, with its price recovering over 36% on Wednesday to an intraday high of $210. But what’s driving this surge, and can SOL reach the coveted $1,000 mark? To answer this, let’s dive into the technical data and market trends surrounding Solana.
Technical Analysis: A Bullish Outlook
According to technical data from CoinTelegraph Markets Pro and TradingView, Solana’s price action has painted a bullish megaphone pattern in the weekly chart. This pattern, also known as a widening wedge, forms when the price generates a series of higher highs and higher lows. In technical terms, a breakout above the upper boundary of the pattern can trigger a parabolic increase.
The relative strength index (RSI) has been increasing from 49 to 61 since the beginning of August, indicating that the bullish momentum is consistently building up. Furthermore, the Solana price has broken out of a cup-and-handle pattern in the weekly chart, as shown below. The price is still above the upper boundary of the pattern at $160, confirming that the breakout is still intact.
Bulls are now focusing on the breakout of the cup’s handle at $250 to continue the rally. Additionally, the price of Solana could rise to the Fibonacci retracement analysis of up to $1,030.
Open Interest Reaches All-Time Highs
Solana’s open interest (OI) at futures markets reached an all-time high of $13.68 billion on Saturday, signaling strong speculative interest in the derivatives market. This high demand indicates that derivative traders are betting on the upward trajectory of Sol, which may be reinforced by institutional inflows and ETF speculations.
High open interest rates are often preceded by significant price movements, as seen between April and July, when an increase in OI was followed by a 103% increase in the SOL price. The current increase in OI and a price increase of 17% to around $217 coincides with the approval of the Alpennglow upgrade, increasing investor confidence.
The Alpennglow upgrade, approved with 98.27% support, reduces Solana’s transaction time from 12.8 seconds to 150 ms and increases throughput to 107,540 TPS. This improves Solana’s competitiveness against Ethereum and may lead to new all-time highs in 2025 as institutional adoption and defect growth accelerates.
On-Chain Activity: A Different Story
However, on-chain activity tells a different story. Despite Solana’s DeFi ecosystem having a total value locked (TVL) of $12 billion and leading token launches, network activity has not scaled proportionally with the price. In the last 30 days, Solana’s transaction count fell by 99%, indicating that the price recovery may be restricted.
In contrast, according to Nansen, Ethereum’s transactions increased by 39% in the same period. The number of active addresses on Solana also fell by 22%, showing reduced network usage.
The DEX activity on Solana fell for the third week in a row, with weekly DEX volumes, according to Defillama data, dropping 65% to $10.673 billion. These numbers are not particularly encouraging for Sol holders and may be a headwind for future gains.
This article does not contain investment advice or recommendations. Every investment and trade movement involves risk, and readers should conduct their own research before making a decision. For more information on Solana and the cryptocurrency market, visit https://cointelegraph.com/news/solana-charts-1000-sol-price-target-open-interest-all-time-highs?utm_source=rss_feed&utm_medium=rss_tag_altcoin&utm_campaign=rss_partner_inbound

