Solana’s price continues to move in a downward trend, despite experiencing a steady influx of investments into its Exchange-Traded Funds (ETFs) over the past 12 days. This phenomenon has sparked interest among investors and analysts, who are seeking to understand the underlying factors driving this trend.
Overview of Solana’s Price Movement
Solana’s price has been trading sideways, hovering around $155, with losses of 2.41% and 1.37% on the weekly and monthly charts, respectively. According to data from crypto.news, the token’s price movement reflects the bearish sentiment prevalent in the crypto market. Despite this, Solana (SOL) ETFs have seen a significant increase in investments, with total inflows recorded at $368.52 million since October 28th.
ETF Inflows and Outflows
The SOL ETFs recorded an inflow of $18.06 million on November 12, with the highest inflow coming from Bitwise’s BSOL fund, which attracted $12.46 million, while Grayscale’s GSOL brought in $5.59 million. In contrast, Bitcoin (BTC) and Ethereum (ETH) ETFs are experiencing outflows, with BTC tracking funds recording $277.98 million in withdrawals and ETH ETFs seeing $183.77 million in outflows. This shift in investor demand could be indicative of a changing landscape in the crypto market.
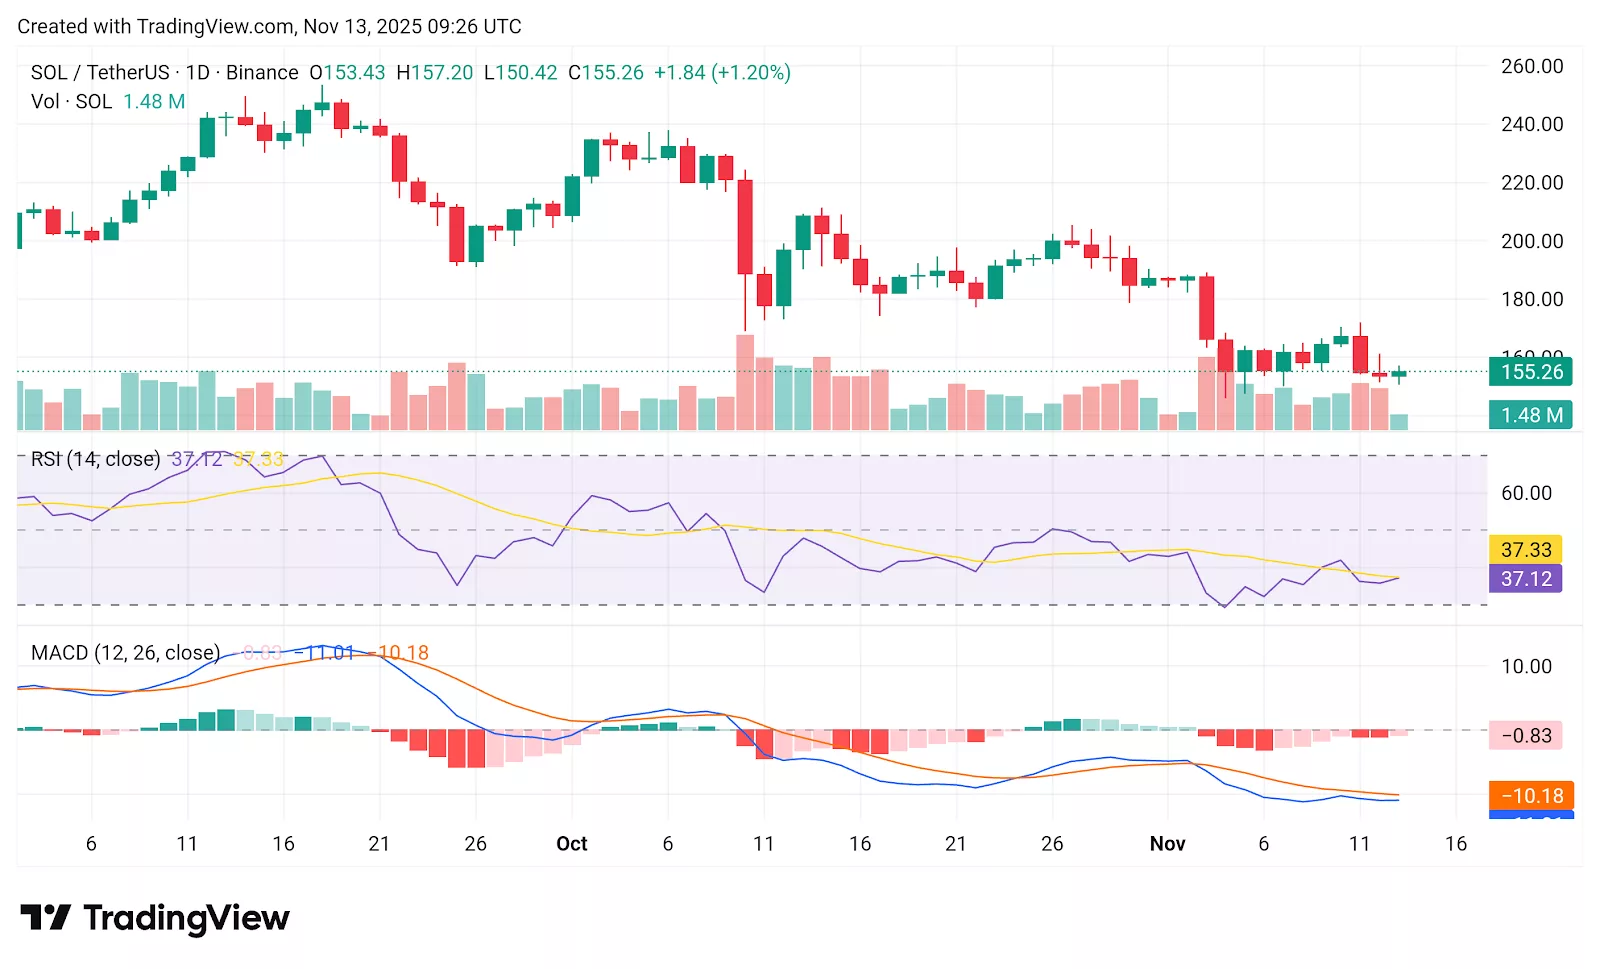
Technical indicators for Solana’s price are currently bearish, with the Relative Strength Index (RSI) at 37.12, showing weak momentum, and the Moving Average Convergence Divergence (MACD) remaining in bearish territory. For an uptrend to occur, the RSI must cross the 50 level, which has not happened yet. The lack of a clear bullish reversal signal contributes to the ongoing decline in Solana’s price.
Support and Resistance Levels
Solana’s price is consolidating in a narrow range between $150 and $162, and a decisive move outside of this zone is likely to determine the next trend. The short-term support level is at $150.42, which has held for the past three sessions. If this level is broken, downward pressure could test the lower support around $142. On the upside, the immediate resistance lies at $162, and a stronger breakout would need to reclaim the $173 level to positively influence short-term sentiment.
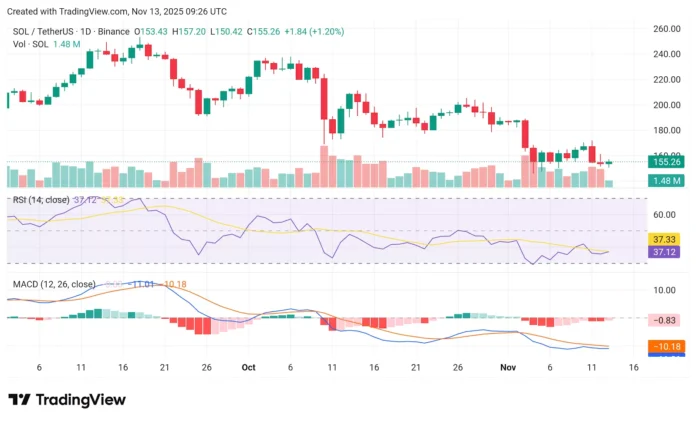
 Solana price chart amid SOL ETF inflows | Source: crypto.news
For more information on Solana’s price movement and the impact of ETF inflows, visit https://crypto.news/solana-price-remains-stuck-around-155-even-as-sol-etf-inflows-jump/

