Solana Price Plummets Despite Spot ETFs Crossing $500 Million Milestone
The Solana price has been experiencing a significant downturn, plummeting over 27% from its peak in August this year. This decline has led to a technical bear market, with the SOL token currently trading at $185, well below its year-to-date high of nearly $300. Despite the introduction of spot Solana ETFs, which have received a warm welcome from American investors, the Solana price continues to fall.
The launch of these ETFs has seen cumulative inflows of almost $200 million, with total assets surpassing the $500 million mark. This milestone is significant, representing 0.50% of the token’s market cap. Bitwise’s BSOL ETF leads the way with $400 million in total assets, thanks to its first-mover advantage and lower fees, with an expense ratio of 0.20%. Grayscale’s offering, on the other hand, has a higher expense ratio of 0.35% but offsets this with staking solutions that allow investors to earn returns of up to 7.5%.
Reasons Behind the Decline
There are two possible reasons why the Solana price fell after the ETF was launched. Firstly, the launches coincided with a difficult week for the market, with most tokens plummeting. Bitcoin (BTC) fell to $108,000, and the market cap of all tokens fell to $3.7 trillion. This broader sell-off can cause even the strongest tokens to crash. Secondly, traders may be selling the news, a situation where crypto assets collapse before a major event and then fall when it occurs.
Looking ahead, potential catalysts for Solana include the upcoming approval of more ETFs and the Alpenglow upgrade, which is expected to boost its performance. These developments could potentially reverse the current downward trend and lead to a resurgence in the Solana price.
Technical Analysis of SOL Price
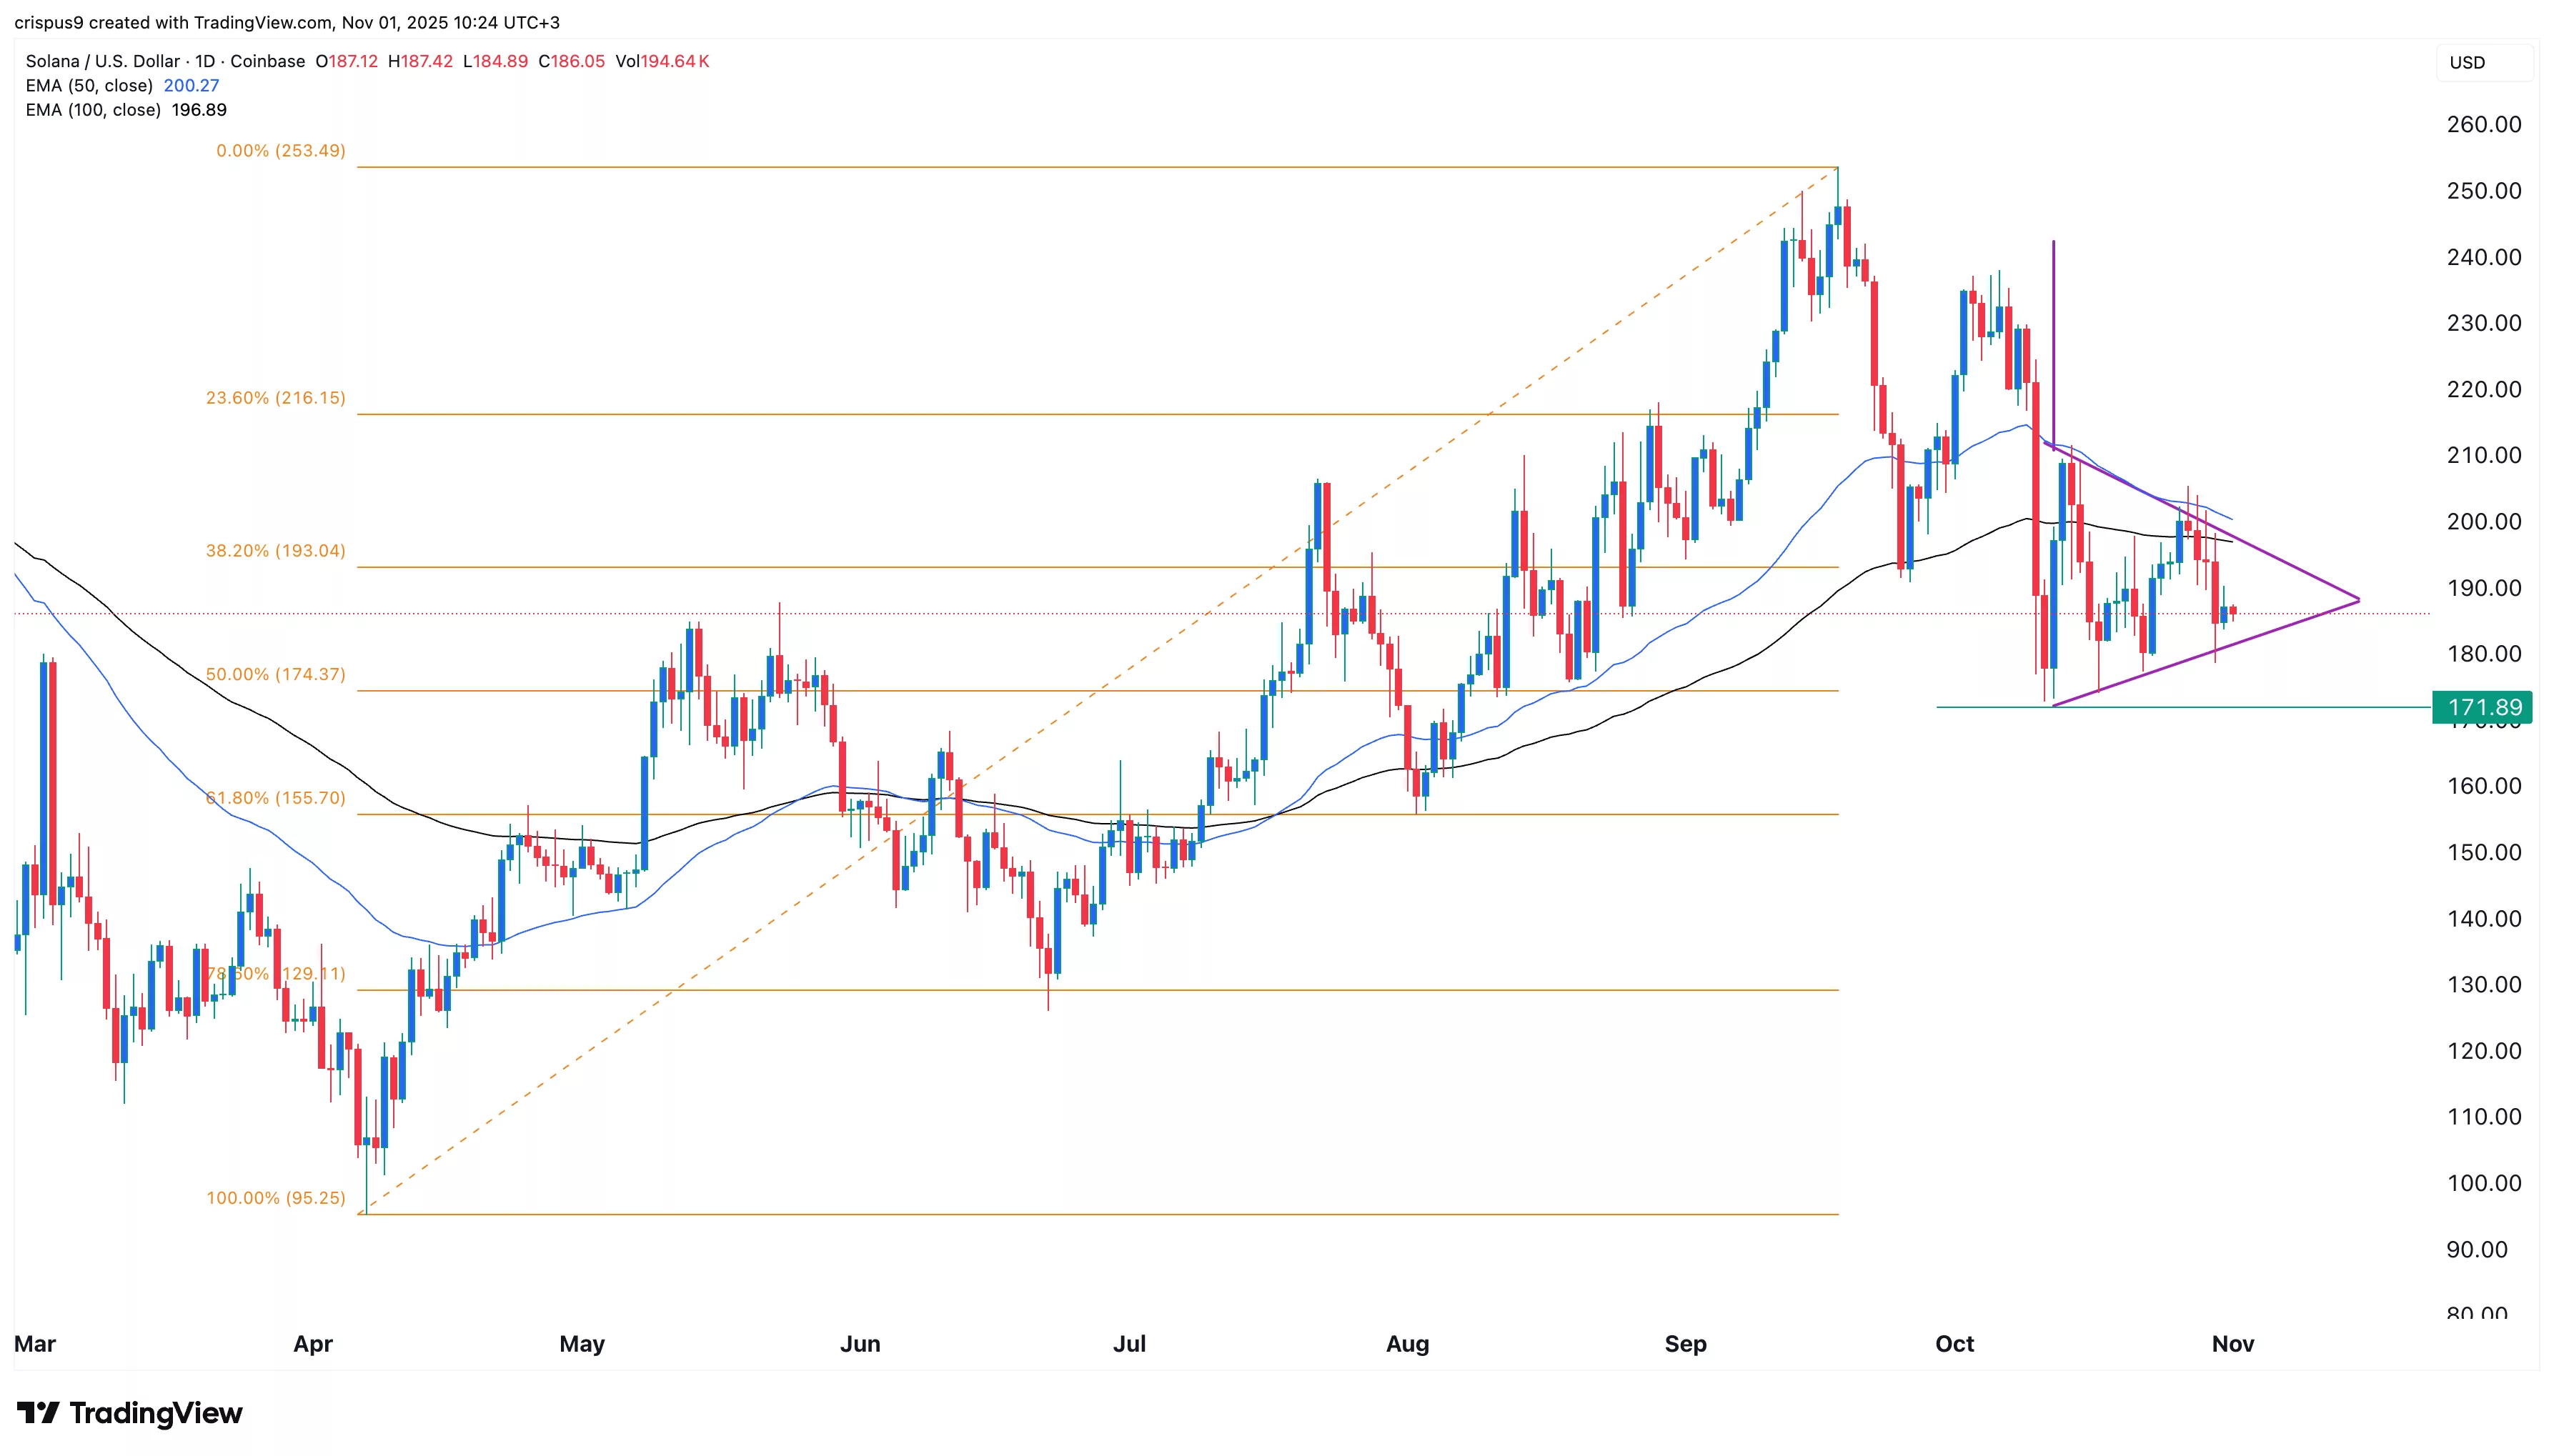
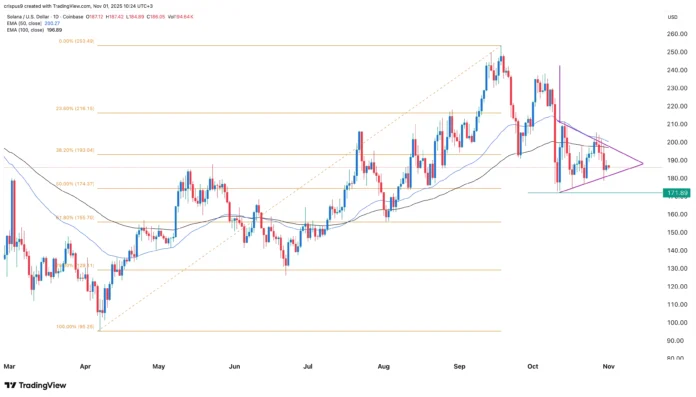
The daily chart shows that the Solana price has been falling over the past few months, with the token now below the 38.2% Fibonacci retracement level. Additionally, the SOL price has moved below the 50-day and 100-day exponential moving averages. The formation of a bearish pennant pattern is nearing completion, and the token is lower than the Supertrend indicator. These technical indicators suggest that the token is likely to continue falling, with sellers targeting the next key support level at $171, the lowest level on October 11 and the 50% retracement level. A break below this level could lead to further downside, potentially to $150.
 Solana price chart | Source: crypto.news
For more information on the Solana price and the impact of spot ETFs, visit https://crypto.news/heres-why-solana-price-plummeted-sol-etfs-cross-500m/

