Solana Price Plummets 6%: Understanding the Recent Decline
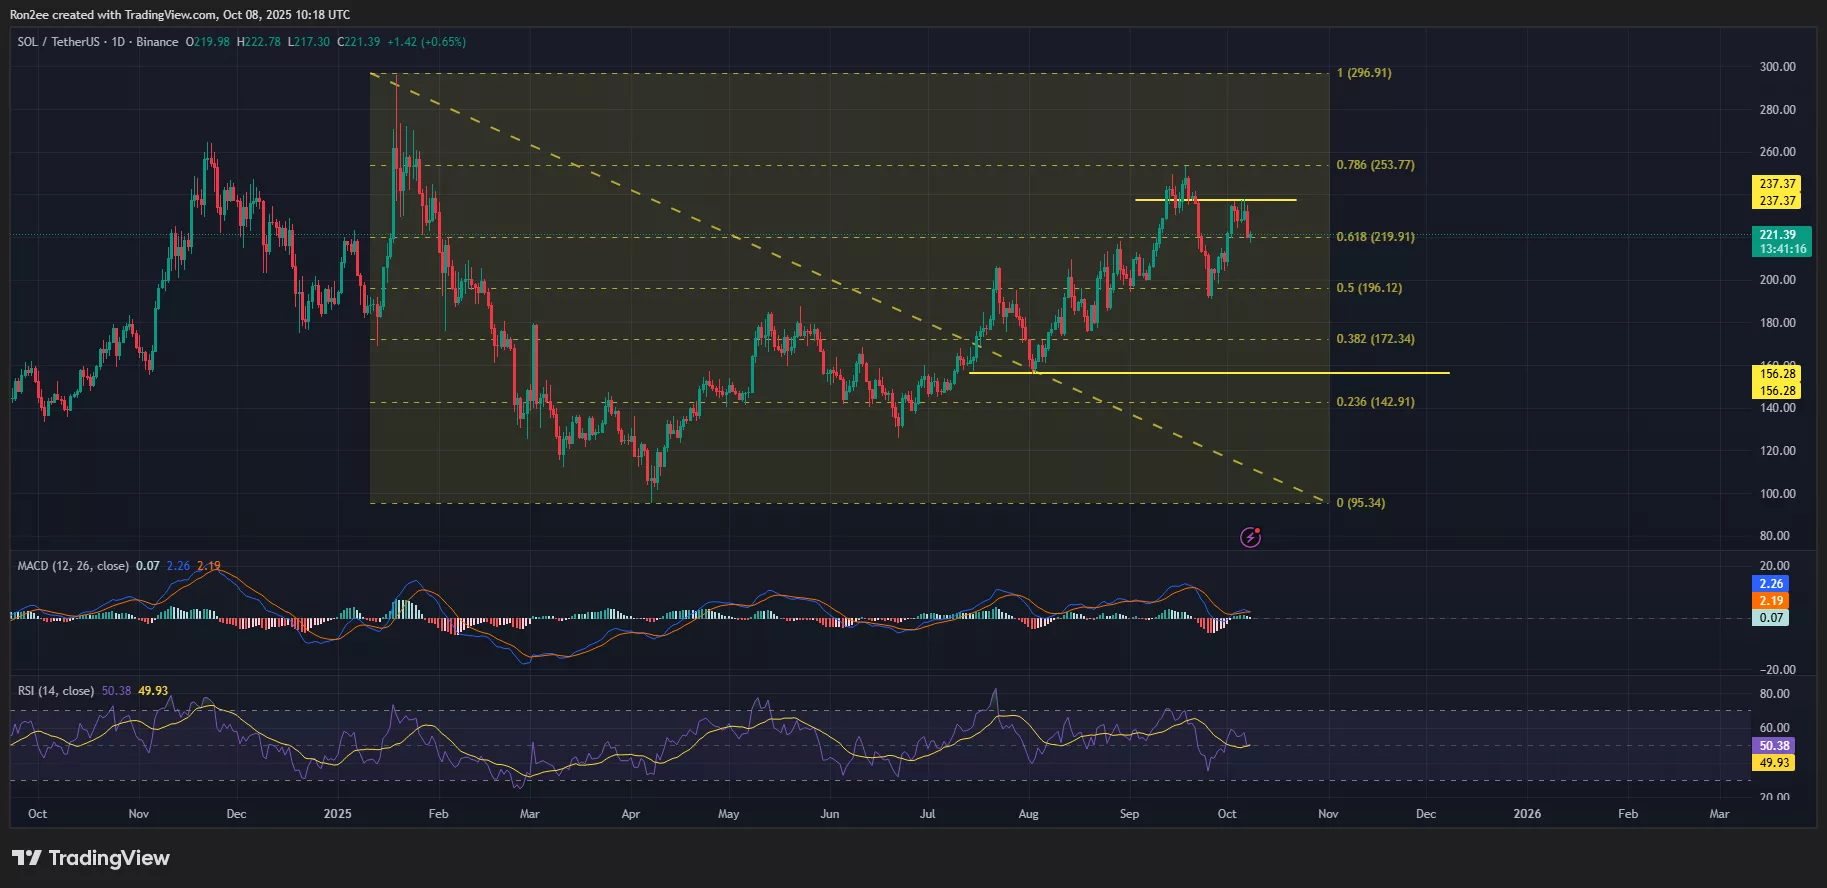
Solana, the sixth-largest cryptocurrency by market capitalization, has experienced a significant decline in its price over the past 24 hours, falling 6% to an intraday low of $218.4 on October 8. This downturn has raised concerns among investors and sparked discussions about the potential factors contributing to this decline. According to recent data, the price of Solana (SOL) has been struggling to break through the resistance level at $237, resulting in a shift in momentum towards the bears.
Factors Contributing to the Decline
One of the primary factors contributing to the decline in Solana’s price is the significant amount of liquidations observed across the crypto market. On October 8, over $606 million in liquidations were reported, with more than $460 million wiped out from long positions alone. Solana was not immune to this trend, facing nearly $40 million in long liquidations compared to just $10 million in short positions. This forced closure of leveraged long positions has triggered a chain reaction, dragging prices lower.
The failure of bulls to break through the resistance level at $237 has also led to a decrease in investor demand for SOL. As a result, the altcoin broke below its local support level of $225, exacerbating the sell-off that began as traders booked profits and turned away from riskier assets following the US government shutdown. This has rattled overall market sentiment, contributing to the decline in Solana’s price.
Technical Indicators and Sentiment Analysis
Technical indicators, such as the Moving Average Convergence Divergence (MACD) and the Relative Strength Index (RSI), have turned bearish, signaling warning signs for the Solana price. The MACD has formed a bearish crossover below the signal line on the daily chart, indicating a focus on the sell side. The RSI has slipped to a neutral reading of around 50.3, suggesting that bulls are losing momentum.
 SOL, price MACD and RSI chart – Oct 8 | Source: crypto.news
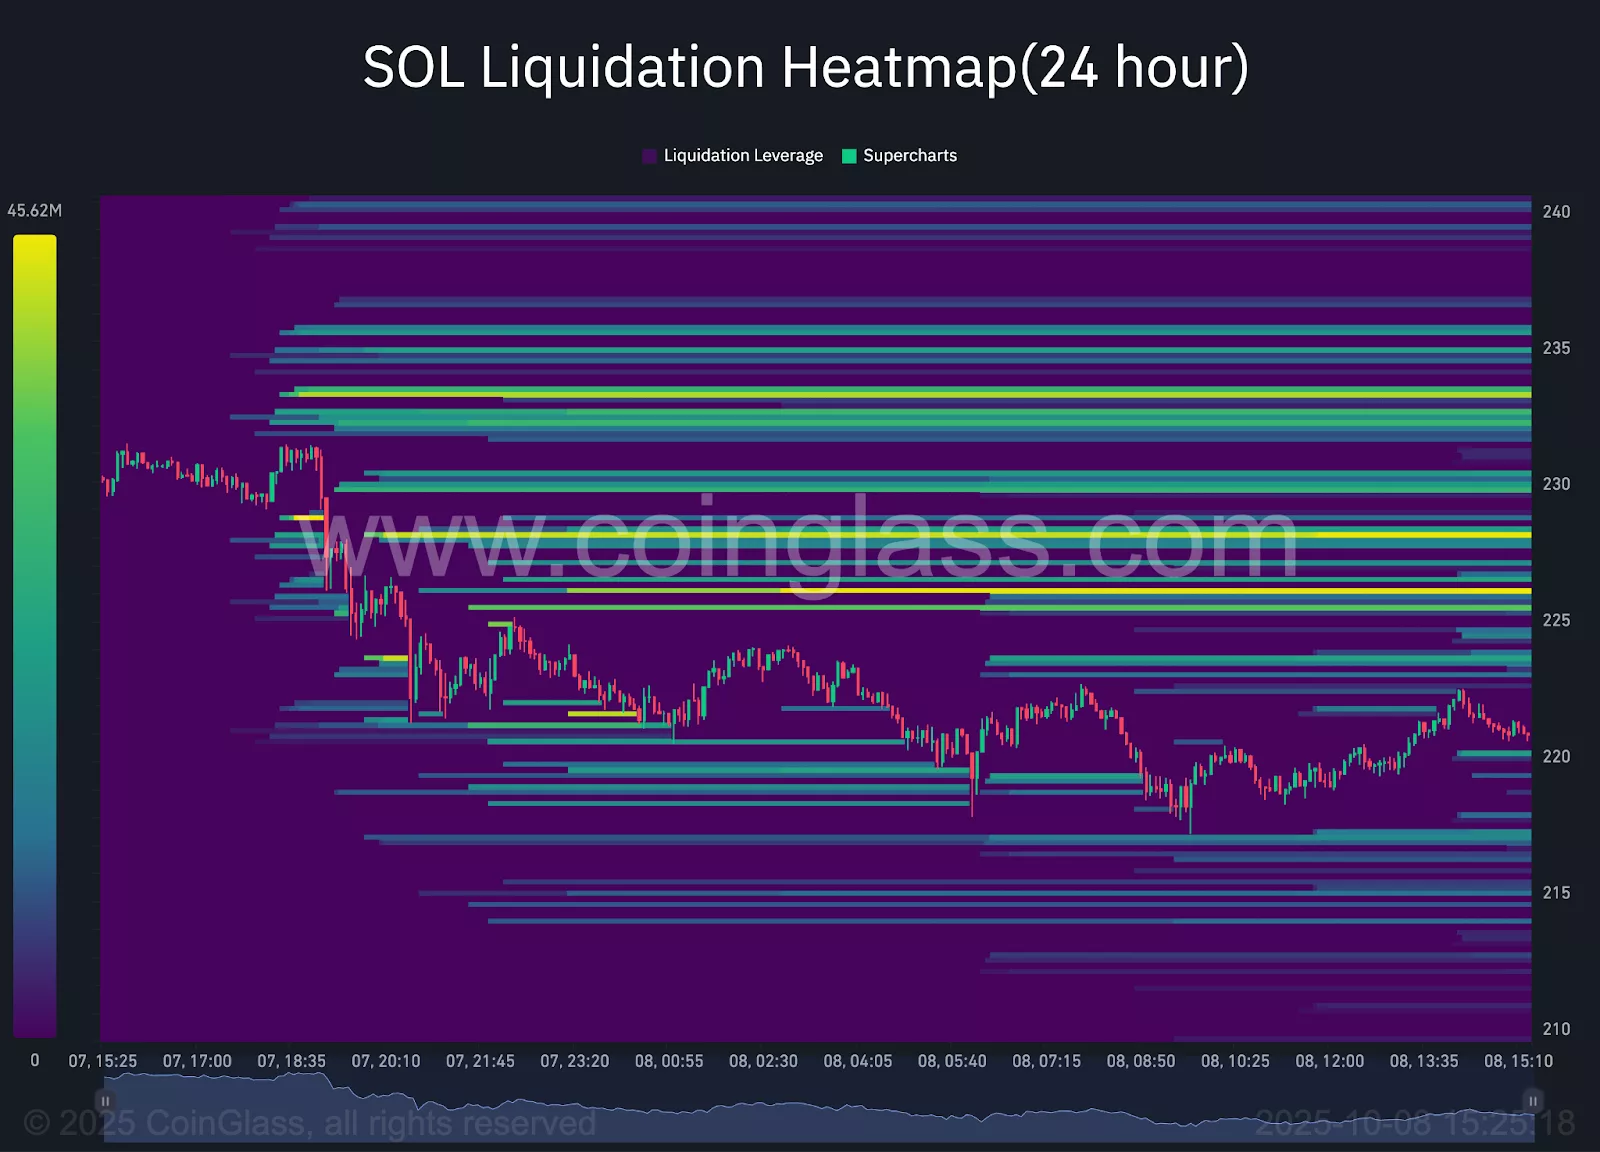
Based on the 50% Fibonacci retracement level, the next key support level to watch is $196. Should SOL fail to sustain above this zone, it could pave the way for a deeper correction towards $156, the August low and a level that previously acted as a strong recovery point. The 24-hour SOL liquidation heatmap reveals dense clusters of liquidation levels between $224 and $228, which could act as short-term resistance.
 24 Hour SOL Liquidation Heatmap | Source: CoinGlass
Future Outlook and Potential Catalysts
While the short-term outlook for Solana price remains bearish, the token is likely to bounce back from this decline, especially with several potential catalysts looming in the coming weeks. One of the most discussed triggers is the possible approval of a Solana spot exchange-traded fund in the United States, possibly shortly after the end of the ongoing government shutdown in the US. If approved by the Securities and Exchange Commission, such a fund would allow traditional investors to gain exposure to SOL without directly holding the asset.
Institutional investors, such as Galaxy Digital and Franklin Templeton, have increased their exposure to Solana, demonstrating confidence in the network’s long-term potential and its growing role in the broader digital asset market. Technical upgrades, including Firedancer and Alpenglow, are expected to significantly improve Solana’s reliability, transaction speed, and overall scalability, addressing long-standing concerns about network outages and performance degradation.
For more information on the recent decline in Solana’s price and its potential future outlook, visit https://crypto.news/why-is-solana-price-down-6-today-8-oct/

