XRP Price Analysis: A 50% Recovery on the Horizon?
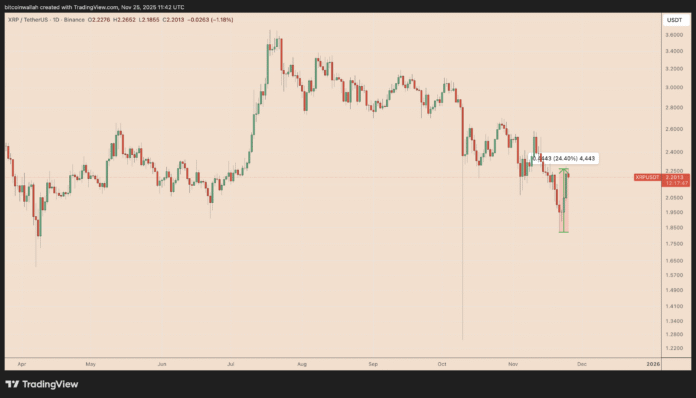
XRP (XRP) has rallied nearly 25% from the psychological $2 mark over the past week, with tailwinds from strong daily ETF inflows of over $164 million following the launches of Grayscale’s GXRP and Franklin Templeton’s XRPZ. This significant price movement has sparked interest among investors and analysts, who are now eyeing a potential 50% recovery for the cryptocurrency.
XRP/USDT daily price chart. Source: TradingView
Key Insights and Technical Analysis
XRP remains bullish above $2, with technicals on the chart pointing towards $3.30-$3.50. However, resistance at $2.23-$2.50 could take the bears back to $1.82. Analysts are closely watching the price movement, citing on-balance volume (OBV) behavior as a key indicator of the uptrend. OBV is a simple way to determine whether actual buying or selling is happening behind the scenes, and for XRP, it has rebounded from a key support area as the price reached $2.
XRP/USDT weekly chart. Source: TradingView
XRP’s 2017 Fractal Setup and Potential Breakout
According to analyst GalaxyBTC, XRP’s current structure accurately reflects the situation that triggered the explosive breakout in 2017. The $2 area behaves similarly to the middle support that XRP reclaimed just before its historic rally eight years ago. XRP is once again rallying within a familiar green accumulation zone while still respecting the broader breakout structure established in early 2025.
XRP/USD weekly chart. Source: TradingView/GalaxyBTC
Challenges Ahead and Potential Roadblocks
Despite the improving sentiment, XRP still needs to overcome several technical hurdles to confirm a sustained upward move. The token tested the 0.236 Fibonacci Retracement level near $2.23 as resistance, and a decisive breakout above this level would then encounter the 50-day EMA (red) and the 200-day EMA (blue), both of which have been limiting XRP’s upside attempts since early October.
XRP/USDT daily price chart. Source: TradingView
Conclusion and Investment Advice
In conclusion, XRP’s price movement is being closely watched by investors and analysts, who are eyeing a potential 50% recovery. However, it is essential to conduct thorough research and consider multiple perspectives before making any investment decisions. This article does not contain any investment advice or recommendations, and readers should always prioritize caution and due diligence in the volatile cryptocurrency market. For more information and analysis, visit https://cointelegraph.com/news/xrp-looking-very-bullish-25-percent-gains-how-high-can-it-go

